The ‘Diseased’ Connection
Finding a link between Cancers using RNA-seq data
Introduction
Over the past decade , our understanding of the genetic makeup of disease has progressively been revolutionized by the emergence and growth of technologies and high throughput analyses in the field of genomics. These technologies have generated massive amounts of data, that reveals novel underlying patterns and associations across a variety of diseases. Many studies have shown that varied diseases share one or more common genetic origins. Goh et al., (2007), in “The Human Diseasome” explore many such links between a variety of diseases. The ‘diseasome’ contained a highly interconnected web of cancers that caught our attention. Through this project, we aim to further analyse the links between various cancers by studying gene expression patterns from RNA-seq data.
The liver is the most common site for cancers to spread to after the lymph nodes. Most of these originate from cancers of the colon, rectum, pancreas, stomach, esophagus, breast, lung, melanoma and some other less common sites. Secondary, or metastatic, liver tumors begin as primary cancers in other organs such as the colon, rectum, pancreas, stomach, lung or breast.

Figure 1 Connection between Lung, Liver and Pancreatic cancer, as depicted by Diseasome (Goh, et al., 2007)
Aim
We aim to answer the following questions through this project
- Is there a common set of genes that are differentially expressed across cancers?
- Are there a particular set of pathways commonly affeted across these cancers?
To answer the above questions we chose to analyse RNA-seq expression data for Lung Adenocarcinoma, Hepatocellular Carcinoma and Pancreatic Cancer.
Background
Cancer is the defined by the ability of cells to divide uncontrollably, and invade other tissues. Normal cells die when damaged and divide only when needed e.g. in order to repair an injury, or to replace old or damaged cells that die, this does not hold true in case of cancerous cells, which neither die when old nor divide only in response to the bodies’ requirement (See Figure 2). Such abnormalities result from mutations in the genetic material, which affect the genes involved in cell growth and differentiation. Several genes have been implicated in this regard such as oncogenes (e.g. RAS, MYC etc.), tumor suppressor genes (e.g. p53, BRCA1, BRCA2 etc.) or angiogenic genes (e.g. ANGPT1, AMOT etc.). The mutations affecting these genes may be inherited i.e. germline mutations, or acquired i.e. somatic mutations, and may be brought about by various factors such as exposure to UV, certain infections (e.g. hepatitis C), and coming into contact with carcinogens (e.g. tobacco use). (National Cancer Institute, 2014)

Figure 2 Cancers are caused by a series of mutations. Each mutation alters the behavior of the cell somewhat (Carcinogenesis, 2014).
According to the latest published statistics, it is indicated that the highest incidence rate for lung cancer, followed closely by breast cancer and bowel cancer (See Figure 3).

Figure 3 Rate of incidence of cancer world wide in 2012 a) Number of new cancer cases in millions b) percentage of new cancer cases (Worldwide Cancer Factsheet, 2014).
Approach
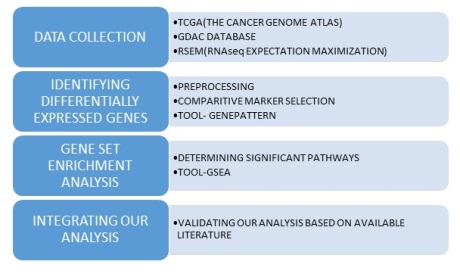

Identifying Differentially Expressed Genes
The gene pattern tool and modules,(Reich, et al., 2006) were used to identify differentially expressed genes.
-
Pre-Processing
Pre-Processing of expression data to remove noise and the “uninteresting” gene variants that are not useful for future analysis.
Module used : PreprocessDataset (Gould, 2013)
This module performs various operations :
- Set floor and ceil values : Any expression value higher than ceiling is removed (to eliminate biases). Any expression value below the floor is removed(to eliminate noise).
- Sample-count threshold filtering : To remove data that may be of low quality, we remove the genes that have insufficient “count” of data that has to be above a specified “threshold”.
- Variation filtering : Genes with small variations based on fold change and delta across multiple samples are less likely to have biological significance in downstream analysis.
- Row normalization and log2 transform : For row normalization, the expression values across samples are normalized to remove systematic variations. log2 transformation brings the same degree of up- and down- regulated genes to the same level.
Comparative Marker Selection
Module used : ComparativeMarkerSelection
Input file : .gct/.cls
Output file : .odf
Using this module we identify the differentially expressed genes(marker genes) that can discriminate the distinct classes of samples used i.e. the tumor and the normal. The module compares the test statistic for the two classes for a particular gene for statistically significant differences.
Information in output file :
- FDR : (False Discovery Rate) It is the expected proportion of erroneous rejections among all rejections.
- FWER : (Family Wise Error Rate) The probabilty of atleast one null hypothesis(the expression level in the normal cells) having a score better than or equal to the observed one.
- Bonferroni : Bonferroni correction applied to feature specific p-value.
- Q-value : An estimate of the FDR using Storey and Tibshiani procedure.
- P-value : The significance of the marker genes ie the feature specific nominal p value is computed using a permutation test .
- Fold change : Class zero mean divided by class one mean ie the quantified expression of the tumor cell genes divided by those of normal cell genes.
Results
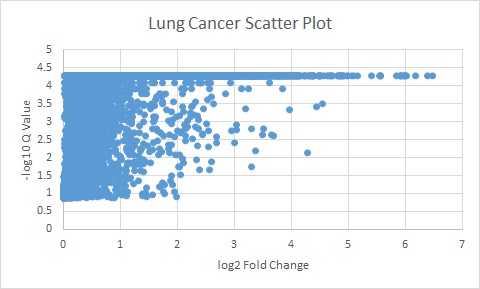
The results from the comparativeMarkerSelection were tabulated and sorted as follows.

The following plots are the log of the Q valules vs the log of Fold change.
All genes above the Q value of 0.05 and Fold change of 5 were used for further analyses.


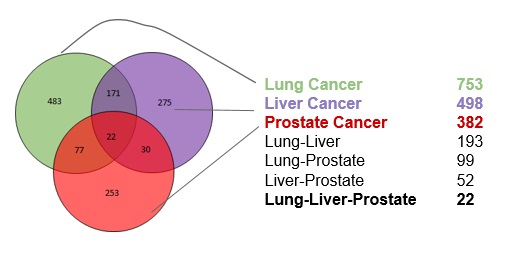
The differntially expressed genes for the three datasets can be summarized as follows:
Gene Set Enrichment Analysis
We have RNA-seq data from studies of lung cancer patients and liver cancer patients and pancreatic cancer patients. Gene Set Enrichment Analysis is a statistical analysis tool by the Broad Institute which can determine the gene sets that are over and under expressed and identify groups of genes that are regulated together. In this case the gene set we chose represent pathways.

The enriched pathways were ranked according to an enrichment score and tabulated for each of th cancers by sorting them according to an enrichment score.

HeatMaps for each of the top pathways were constructed:
Pancreatic Cancer

Liver Cancer

Lung Cancer

Discussion
There were 22 genes that showed common expression patterns across all the three cancers. What validates our result in a way, is that, most of these genes have been implicated in various cancers. The genes roughly belong to the Cell Cycle, Apoptosis, Transcriptional regulation pathways.
|
IQGAP3 |
|
FAM83D |
|
EEF1A2 |
|
CPLX2 |
|
UGT1A10 |
|
HOXA10 |
|
HMGA2 |
|
FABP4 |
|
AKR1B10 |
|
CA9 |
|
PPP2R2C |
|
SLC7A11 |
|
PAEP |
|
BAIAP2L2 |
|
S100P |
|
MUC13 |
|
VSIG1 |
|
DNASE1L3 |
|
MMP12 |
|
SLC7A11 |
|
LOC84740 |
After performing the Gene Set Enrichment Analysis, 5 out of the 1320 pathways analysed, were differentially expressed in all the three cancers.

The Cell cycle controls the dicvsion of cells. Upon disregulation of the cell cycle, the checkpoints are disturbed and cells proliferate much faster resulting in cancers. (Hartwell et. al, 1994)
The FOXM1 pathway, contains the FOXM1 protooncogene, which upon upregulation, results in cancer.(Laoukili et. al, 2007)
Disregulation in the DNA replication pathway results in DNA damage, which inturn results in cancer.(Umar et. al, 1997)
The glycolysis and Nucleotide metabolism pathways indirectly control the formation of dNTPs, which are crucial for the formation of DNA. An inbalance of dNTP levels have been implicated in Cancers. (Aird et. al , 2014)
Conclusion
We believe there is significant overlap to conclude that a common set of genes are affected in all three cancers. We can also successfully conclude that a few common pathways are affected in these three cancers. However, it would be interesting to explore how these genes and pathways behave in other cancers. The potenitial uses for such an approach could be to device a therapies for cancers that don’t yet have a cure. If two diseases one with a known cure and the other with an unkown cure have a similar gene expression pattern, the cure for the first disease can be manipulated to be used for the second disease too.
Posted on November 1, 2014, in Gene expression. Bookmark the permalink. Leave a comment.

Leave a comment
Comments 0