Author Archives: 0611xiaotong
Group 10’s Analysis of Variants within a Male from Southern Han Chinese Population in the 1000 Genomes Project
Introduction
In this project, we aim to analyze single nucleotide variations (SNVs) of a human genome from 1000 Genomes Project. We used assembly GRCh38 as the human reference genome and HG00698 as the sample chosen for study. The sample is composed of a set of variants found within a male from the Southern Han Chinese population (http://www.internationalgenome.org/data-portal/sample/HG00698). The scope of our project includes genome mapping, variant filtering, and analysis of a subset of variants found. This aims to provide an overview of the prevalence and frequency of mutant proteins in the male. The following table provides more information on this sample, denoted as HG00698 in the 1000 Genomes Project.
| Ethnicity | Southern Han Chinese |
| Country of Origin | China |
| Species | Homo sapiens |
| Common Name | Human |
| Gender | Male |
Table 1. Information on HG00698 sample
Workflow

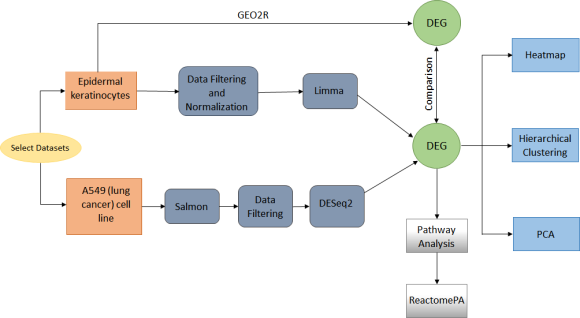
Figure 1. Project workflow
Parameters chosen for the filtering process to infer the most likely pathogenic variants are listed below:
- Variants must have ExAC database frequency lower than 0.1% over all ethnic populations, to be rare enough to possibly fall under the pathogenic category.
- Variants must be of non-synonymous nature to cause changes in protein structure.
- PHRED score from CADD must be larger than 30 to thus cause the variants to be within top 0.1 % deleterious (Helbig 2015).
Out of all the score metrics that could be examined, PHRED score was chosen, since PHRED score lumps the advantages of many score metrics together to enhance the accuracy of pathogenicity prediction (Kircher et al, 2014).
From a list of what was originally 20,459 variants, a list of 27 variants were thus found with the highest likelihood of pathogenicity:
| Gene Name | DBSNP ID | Chromosome | Nucleotide Change Relative to Positive DNA Strand | Amino Acid Change | Overall Frequency in ExAC | PHRED Score from CADD |
| LRCH3 | rs141761986 | chr3 | C > T | R > C | 0.0007 | 35 |
| DDX54 | rs199780486 | chr12 | G > A | R > W | 6.96E-05 | 35 |
| EVI5 | rs117711462 | chr1 | G > A | R > C | 0.0006 | 35 |
| NALCN | rs202228674 | chr13 | G > A | R > C | 4.95E-05 | 35 |
| FBF1 | rs201312076 | chr17 | C > T | D > N | 1.71E-05 | 34 |
| SYNE1 | rs80265744 | chr6 | C > T | R > H | 0.0003 | 34 |
| MYO19 | rs757720951 | chr17 | C > T | R > H | 4.29E-05 | 34 |
| LATS1 | rs200080860 | chr6 | G > A | R > C | 1.66E-05 | 34 |
| HUNK | rs192440238 | chr21 | C > T | R > C | 9.06E-05 | 34 |
| DOCK6 | rs756376586 | chr19 | G > A | R > C | 1.73E-05 | 34 |
| CLPB | rs186989806 | chr11 | G > A | R > C | 8.39E-06 | 34 |
| COQ7 | rs199844241 | chr16 | C > T | R > W | 1.65E-05 | 34 |
| TUBGCP2 | rs200192740 | chr10 | G > A | R > W | 6.68E-05 | 33 |
| PCDHA7 | rs200308248 | chr5 | C > T | R > C | 0.0003 | 33 |
| TGM2 | rs201666703 | chr20 | G > A | R > W | 0.0004 | 33 |
| PVRL2 | rs368892165 | chr19 | C > T | R > W | 0.0001 | 33 |
| MACF1 | rs77696779 | chr1 | G > A | R > Q | 0.0009 | 33 |
| ADGRV1 | rs777161065 | chr5 | C > A | R > T | 8.28E-06 | 33 |
| RUVBL2 | rs776254813 | chr19 | C > A | S > Y | 8.30E-06 | 32 |
| SULT1A2 | rs183030982 | chr16 | C > T | G > R | 3.30E-05 | 32 |
| DENND4C | rs186878103 | chr9 | T > G | F > V | 0.0002 | 32 |
| SLC35D2 | rs74939645 | chr9 | T > A | I > F | 0.0002 | 32 |
| MCM10 | rs75614526 | chr10 | G > A | R > Q | 0.0002 | 32 |
| G6PD | rs72554664 | chrX | C > T | R > H | 0.0004 | 32 |
| MLLT4 | rs78967307 | chr6 | C > G | R > G | 0.0003 | 32 |
| GRWD1 | rs200765474 | chr19 | C > T | R > C | 0.0003 | 31 |
| POLDIP2 | rs782229878 | chr17 | G > A | T > M | 1.66E-05 | 31 |
Table 2. Variants with the most likely pathogenicity
Detailed analysis on four of the variants from Table 2 will follow.
Reference:
Helbig, I. (2015, July 15). Beyond the ion channel. Retrieved
     December 13, 2018, from The ILAE Genetics Commission Blog:
     http://epilepsygenetics.net/2015/07/15/here-is-why-cadd-has-
     become-the-preferred-variant-annotation-tool/

IGSR: The International Genome Sample Resource. (2008). Retrieved
     December 13, 2018, from
     http://www.internationalgenome.org/data-portal/sample/HG00698

Kircher, M., Witten, D. M., Jain, P., O'Roak, B. J., Cooper, G. M.,
     & Shendure, J. (2014). A general framework for estimating the
     relative pathogenicity of human genetic variants. Nature
     Genetics, 310-315. https://doi.org/10.1038/ng.2892
Individual Variant Analysis
Variant 1 By Jialin Ma
Gene Name: G6PD
Variant ID: rs72554664
DNA change: G → A
Amino acid change: R(Arg) → H(His)
Allele frequency in different regional populations according to 1000 Genomes Project:
| Population | Sample Size | Frequency (G) | Frequency (A) |
| East Asia | 1008 | 0.995 | 0.005 |
| Europe | 1006 | 1 | 0 |
| Africa | 1322 | 1 | 0 |
| America | 694 | 1 | 0 |
| South Asia | 978 | 1 | 0 |
| Global | 3775 | 0.999 | 0.001 |
The G6PD gene encodes glucose-6-phosphate dehydrogenase. The protein is a cytosolic enzyme whose main function is to produce NADPH, a key electron donor in the defense against oxidizing agents and in reductive biosynthetic reactions.
This missense variant may affect the normal function of G6PD and lead to G6PD deficiency. G6PD deficiency may cause neonatal jaundice, acute hemolysis, or severe chronic non-spherocytic hemolytic anemia.
I used PolyPhen to predict the effect of the mutation on protein, the result was “possibly damaging”. The complete result is shown in the following. The PPH2PROB value of 0.52 and PPH2TPR (true positive rate at the PPH2PROB level) value of 0.85 indicates a relative high probability that the mutation is deleterious.
RSID rs72554664
TRAININGSET humdiv
OSNPID rs72554664
OACC P11413-3
OPOS 493
OAA1 R
OAA2 H
SNPID rs72554664
ACC P11413-3
POS 493
AA1 R
AA2 H
NT1 G
NT2 A
PREDICTION possibly damaging
BASEDON alignment
EFFECT <NA>
PPH2CLASS deleterious
PPH2PROB 0.52
PPH2FPR 0.126
PPH2TPR 0.85
PPH2FDR 0.228
DSCORE 0.714
SCORE1 1.978
SCORE2 1.264
NOBS 120
NSTRUCT 20
NFILT 11
PDBID 2bh9
PDBPOS 463
PDBCH A
IDENT 1
LENGTH 488
NORMACC 0.269
SECSTR H
MAPREG A
DVOL -20
DPROP 1.03
BFACT -0.36
TRANSV 0
CODPOS 1
CPG 1
IDPMAX 37.529
IDPSNP 37.529
IDQMIN 72.294
COMMENTS chrX:153760472_CT
There are existing clinical significance that the variant is associated with Anemia, nonspherocytic hemolytic, due to G6PD deficiency. The variant was also reported by Chiu et al. (1991).
The wild-type protein structure is show below. The residue (ARG 463) (in red chain) is shown with tooltip.

Note that the residue is in conjunction with another secondary structure. The following two images are colored by polarity of amino acids. Note that Arg 463 (in orange) is in conjunction with Glu 297 (in red). Since Glu is often negative charged and Arg is often positively charged in pH7, a hydrogen bond may form between the two residues in wild-type protein.
The variant will cause Arg 463 become His, which may cause the binding with Glu become weak. This could affect the integrity of the protein structure and lead to abnormal protein function.


Reference:
Chiu, D. T.-Y., Zuo, L., Chen, E., Chao, L., Louie, E., Lubin, B., . . . Du,
     C.-S. (1991). Two commonly occurring nucleotide base substitutions in
     Chinese G6PD variants. Biochemical and Biophysical Research Communications,
     180(2), 988-993. https://doi.org/10.1016/S0006-291X(05)81163-5
Variant 2 By Tzu-Chuan Huang
Gene Name: SYNE1 (spectrin repeat containing nuclear envelope protein 1)
ClinVar ID: RCV000301119.1| RCV000356051.1
Variant ID: 355852
Variant genotype: Single Nucleotide Variant (SNV)
DNA Change: C to T
Amino Acid Change: R5885H
Genome Position: Chr6: 152293733 (on Assembly GRCh38)
Variant Frequency:
- T=0.00039 (96/246180, GnomAD)
- T=0.00057 (71/125568, TOPMED)
- T=0.00035 (42/121398, ExAC)
- T=0.0003 (9/28040, GnomAD)
- T=0.001 (5/5008, 1000G)
- T=0.000 (1/3854, ALSPAC)
- T=0.000 (0/3708, TWINSUK)
Gene function:
SYNE1 encodes a protein, Syne-1, expressed in skeletal and smooth muscle, and in peripheral blood lymphocytes [4]. The encoded protein is the link between plasma membrane and actin cytoskeleton, and is especially critical in the brain and is active in Purkinje cells [2, 3, 5, 6, 7]. The protein is attached on the membrane of Purkinje cells involved in chemical signaling between neurons [2, 3, 5, 6, 7]. The gene mutation may contribute to autosomal recessive spinocerebellar ataxia 8, autosomal recessive cerebellar ataxia type 1 or recessive ataxia of Beauce [2, 3, 5, 6, 7]. It is a slowly progressive disorder associated with motor neuron dysfunction. Patients will undergo cerebellar cognitive and affective syndrome such as verbal working memory, deficits in attention, and visual-spatial skills [1]. Patient may also have problem with judging distance and movement problem.
Gene mutation:
The mutation in SYNE gene cause Syne-1 protein to be a short and dysfunctional version of Syne-1 protein. The abnormal protein impairs the Purkinje cell and disrupts the signal between neurons thus causing the loss of brain cells. This results in movement problems [2, 3, 5].
Frequency:
The condition associated with the gene was first discovered in individuals from the Beauce and Bas-Saint-Laurent regions of Quebec, Canada. It has been a worldwide problem particularly in Japan, Europe, the Middle East and Brazil [1].
Variant status:
According to UniProtKB, there are 12 described isoforms and 17 potential isoforms [8]. Because the mutation variant is not present in all isoforms and there is no existing PDB file, I used SWISS-MODEL to predict the model, and then exported the predicted PDB file to PyMOL. The following model shows the wild-type and the mutation point (Red dot).
Structural model:


References:
[1] Beaudin M, Gamache PL, Gros-Louis F, et al. SYNE1 Deficiency. 2007 Feb 23
     [Updated 2018 Dec 6]. In: Adam MP, Ardinger HH, Pagon RA, et al., editors.
     GeneReviews® [Internet]. Seattle (WA): University of Washington, Seattle;
     1993-2018. Available from: https://www.ncbi.nlm.nih.gov/books/NBK1379/

[2] Dupré N, Gros-Louis F, Chrestian N, Verreault S, Brunet D, de Verteuil D,
     Brais B, Bouchard JP, Rouleau GA. Clinical and genetic study of autosomal
     recessive cerebellar ataxia type 1. Ann Neurol. 2007 Jul;62(1):93-8

[3] Dupré N, Gros-Louis F, Bouchard JP, Noreau A, Rouleau GA. SYNE1-Related
     Autosomal Recessive Cerebellar Ataxia. 2007 Feb 23
     [updated 2011 Oct 13]. In: Pagon RA, Adam MP, Ardinger HH, Wallace SE,
     Amemiya A, Bean LJH, Bird TD, Ledbetter N, Mefford HC, Smith RJH,
     Stephens K, editors. GeneReviews® [Internet]. Seattle (WA): University
     of Washington, Seattle; 1993-2017

[4] GRCh37. (2018, October). Retrieved December 12, 2018, from Ensembl website:
     http://grch37.ensembl.org/Homo_sapiens/Gene/Summary?g=ENSG00000131018;
     r=6:152442819-152958936

[5] Gros-Louis F, Dupré N, Dion P, Fox MA, Laurent S, Verreault S, Sanes JR,
     Bouchard JP, Rouleau GA. Mutations in SYNE1 lead to a newly discovered
     form of autosomal recessive cerebellar ataxia. Nat Genet. 2007 Jan;
     39(1):80-5. Epub 2006 Dec 10.

[6] Izumi Y, Miyamoto R, Morino H, Yoshizawa A, Nishinaka K, Udaka F, Kameyama
     M, Maruyama H, Kawakami H. Cerebellar ataxia with SYNE1 mutation
     accompanying motor neuron disease. Neurology. 2013 Feb 5;80(6):600-1.
     doi: 10.1212/WNL.0b013e3182815529. Epub 2013 Jan 16. Erratum in:
     Neurology. 2013 Mar 26;80(13):1267.

[7] Noreau A, Bourassa CV, Szuto A, Levert A, Dobrzeniecka S, Gauthier J,
     Forlani S, Durr A, Anheim M, Stevanin G, Brice A, Bouchard JP, Dion PA,
     Dupré N, Rouleau GA. SYNE1 mutations in autosomal recessive cerebellar
     ataxia. JAMA Neurol. 2013 Oct;70(10):1296-31

[8] UniProtKB - Q8NF91 (SYNE1_HUMAN). (2018, December 5). Retrieved December 12,
     2018, from UniProt website:
     https://www.uniprot.org/uniprot/Q8NF91#sequences
Variant 3 By Xiaotong Jiang
| Gene Name | RSID | Allele Change | Amino Acid Change | Frequency | Regional Frequency |
| DDX54 | rs199780486 | G → A | Arginine →Tryptophan | 0.00007 | 0.0008 |
The variant rs199780486 describes an exonic mutation in the gene DDX54 that codes for the ATP-dependent RNA helicase DDX54 protein. This gene is on chromosome 12, and the mutation changes a G to an A at position 2207. This causes a single amino acid mutation from R (Arginine) to W (Tryptophan) at position 727 in the protein. The genotype call has a CADD phred score of 35. With CADD score of 20 being the top 1% deleterious variant in the human genome, this score indicates that DDX54 is fairly deleterious. As well, the variant has an allele frequency of 0.00007 in all populations, and a frequency of 0.0008 in East Asian populations.
DDX54 encodes a member of the DEAD box protein family. DEAD box proteins, characterized by the conserved motif Asp-Glu-Ala-Asp (DEAD), are putative RNA helicases. They are implicated in a number of cellular processes involving alteration of RNA secondary structure such as translation initiation, nuclear and mitochondrial splicing, and ribosome and spliceosome assembly. Based on their distribution patterns, some members of this family are believed to be involved in embryogenesis, spermatogenesis, and cellular growth and division. The nucleolar protein encoded by this gene interacts in a hormone-dependent manner with nuclear receptors, and represses their transcriptional activity. Alternative splice variants that encode different isoforms have been found for this gene.
Rajendran et al. (2003) showed that DDX54 displayed ATP-dependent RNA helicase activity. In vitro binding and yeast 2-hybrid analysis showed stronger interaction for antiestrogen-liganded ER-alpha than for estradiol-liganded ER-alpha. In DDX54-transfected Chinese hamster ovary (CHO) cells, transactivation assays demonstrated that DDX54 repressed ER-alpha transcriptional activity, and DDX54 also displayed nuclear receptor corepressor activity against ER-beta (ESR2; 601663), progesterone (PGR; 607311), glucocorticoid (GCCR; 138040), and RARA (180240). Deletion studies and Gal4 fusion studies showed that DDX54 amino acids 589-631 function as the transcriptional repression domain and that the C-terminal DDX54 amino acids 664-865 interact with the C-terminal portion of nuclear receptors. Both antisense and siRNA knockdown of DDX54 caused an increase in ER transcriptional activity and expression of estradiol-stimulated genes.
Swiss Model was used to predict the 3-D structure of the wild type protein and the mutant protein. The mutant amino acid is highlighted in red in the images below. The structure seems to change slightly, but we cannot make any definite conclusions due to the fact that these are predicted structures and not experimentally determined crystal structures.


References:
Rajendran, R. R., Nye, A. C., Frasor, J., Balsara, R. D., Martin, P. G. V.,
     Katzenellenbogen, B. S. Regulation of nuclear receptor transcriptional
     activity by a novel DEAD box RNA helicase (DP97).
     J. Biol. Chem. 278: 4628-4638, 2003.
Zhan, R., Yamamoto, M., Ueki, T., Yoshioka, N., Tanaka, K., Morisaki, H., . . .
     Aiso, S. (2013). A DEAD‐box RNA helicase Ddx54 protein in oligodendrocytes
     is indispensable for myelination in the central nervous system. Journal of
     Neuroscience Research, 91(3), 335-348. https://doi.org/10.1002/jnr.23162
Variant 4 By Jason Ye


Figure 1a (left): wild type protein coded by gene LRCH3
Figure 1b (right): variant protein coded by gene LRCH3
Figure 1a above shows a structural model of the protein with RefSeq accession number NP_116162.1, encoded by gene LRCH3 through mRNA with RefSeq accession number NM_032773.3. In Figure 1b, at position 1987 relative to the start of the mRNA sequence that codes for the protein, base pair C in codon CGT was changed to T in codon TGT on chromosome 3, corresponding to an amino acid change from R to C at position 663. This figure shows the nonsynonymous variant protein, with dbSNP ID rs141761986, and with one of the highest PHRED scores of 35 compared to other variants. Variant rs141761986 is, thus, a missense variant R > C, coded by coding sequence variant C > T on the positive DNA strand.
From SWISS-MODEL, all templates for either the original wild type or variant protein sequence reveal less than 27 % identity relative to the target protein sequence. Furthermore, the protein encoded by LRCH3 is a monomeric leucine-rich repeat protein with no ligands. Only one template from SWISS-MODEL fits into this category for both wild type and variant protein sequence. Thus, this template was the only template chosen for modeling. Due to identity of only 16.17 % between template and target protein sequences, it is unsurprising that QMEAN score fell far below -4 for both the wild type and the variant protein models. Namely, QMEAN score was -6.86 for the original protein model and -6.50 for the variant protein model. This means that neither of the two protein models is of sufficiently good quality.
This variant has a frequency of 0.07 % in the population across the ExAC database, and a frequency of 0.61 % in only ExAC’s East Asian population. This variant has not been reported to NCBI’s ClinVar website (https://www.ncbi.nlm.nih.gov/snp/rs141761986/). However, the majority of variants published on ClinVar website for LRCH3 in human beings (https://www.ncbi.nlm.nih.gov/clinvar/?term=lrch3%5Bgene%5D) were of pathogenic nature associated with either physical deformation or developmental delay. This makes sense, since the description of LRCH3 as “leucine-rich repeat and calponin homology domain” (https://www.ncbi.nlm.nih.gov/gene/84859) implies this gene having impacts on muscle cells and protein synthesis, as one would expect from meals high in protein. Due to the absence of detailed information for variant rs141761986, along with its high PHRED score of 35, it can thus be reasonably inferred that this variant too may be pathogenic, causing either physical deformation, developmental delay or both.
It should also be noted that position 663 at which R changes to C in the protein sequence corresponds to a region of the chosen template that has undergone deletion. As a result, no evident structural changes could be seen between the two diagrams from Figures 1a and 1b above. However, since deletion in the template strand corresponds to lack of information from the template used to form the protein models, the absence of structural changes seen between Figures 1a and 1b could not, alone, be used to claim the benign nature of variant rs141761986. Other information such as PHRED score, ExAC frequency and other variants’ pathogenicity for LRCH3 must also be accounted for to infer the pathogenicity of this variant.
With the possibility of variant rs141761986 causing physical and developmental abnormalities in human beings, people with this variant must first be aware of this possibility. These people should perform at least annual physical checks. In this way, as soon as these abnormalities are found, necessary operations such as surgeries could be performed at the earliest opportunity. This may help to prevent the onset of more serious problems such as cancer that could arise in later stages of life.
References:
ClinVar. (n.d.). Retrieved December 13, 2018, from NCBI website:
     https://www.ncbi.nlm.nih.gov/clinvar/?term=lrch3%5Bgene%5D

Gene. (2018, December 9). Retrieved December 13, 2018, from NCBI website:
     https://www.ncbi.nlm.nih.gov/gene/84859

U.S. National Library of Medicine. (2018, October 2). Retrieved December 13,
     2018, from National Center for Biotechnology Information website:
     https://www.ncbi.nlm.nih.gov/snp/rs141761986/
Gene Expression Analysis of Dexamethasone’s Treatment Effects on Epidermal Keratinocytes (i.e. skin cells) and A549 Cell Line (i.e. a lung cancer cell type) from the Human Body
Group Member: Jason Ye, TzuChuan Huang, Jialin Ma, Xiaotong Jiang
Introduction
Glucocorticoid (GC) dexamethasone is known as a highly effective anti-inflammatory, immunosuppressant and a decongestant drug (Bordag et al, 2015). For decades, it has been applied to a variety of disease conditions, ranging from auto-immune diseases and allergic reactions to cancers (Bordag et al, 2015). It can, thus, immensely improve both prognosis and quality of life (Bordag et al, 2015). Unfortunately, glucocorticoid therapy can cause serious systemic side effects, especially in chronic and high dose applications, leading to decreased life expectancy and increased health care costs (Bordag et al, 2015).
Gene expression patterns provide us with insights on how drugs and cells interact. In this study, we chose two datasets dealing with epidermal keratinocytes and A549 cell line as our subjects of interest, and studied their gene expression profiles upon treatment by dexamethasone. By doing so, we hoped to unravel some side effects of dexamethasone.
A keratinocyte is the predominant cell type in the epidermis, the outermost skin layer, constituting 90% of the cells found there (https://en.wikipedia.org/wiki/Keratinocyte). The primary function of keratinocytes is the formation of a barrier against damages, such as those from fungi and UV radiation (https://en.wikipedia.org/wiki/Keratinocyte). A number of structural proteins (e.g. filaggrin, keratin), enzymes (e.g. proteases), lipids and antimicrobial peptides (e.g. defensins) work together to maintain the important barrier function of the skin (https://en.wikipedia.org/wiki/Keratinocyte).
A549 cells, as found in the lung tissue of their origin, are squamous and responsible for the diffusion of some substances, such as water and electrolytes, across alveoli (https://en.wikipedia.org/wiki/A549_cell). A549 cells are widely used as a transfection host and as a type II pulmonary epithelial cell model for drug metabolism (https://en.wikipedia.org/wiki/A549_cell). When grown for sufficient time in a cell culture, A549 cells may begin to differentiate, as signaled by the presence of multilamellar bodies (https://en.wikipedia.org/wiki/A549_cell).
Objectives
- To analyze the treatment effect of dexamethasone on epidermal keratinocytes and A549 cell line (adenocarcinomic human alveolar basal epithelial cells) by comparing differentially expressed genes.
- To determine the effect of synthetic glucocorticoid (GC) dexamethasone on pathway regulation based on molecular response, as GC serves as a therapeutic agent for skin conditions.
Methodology
Workflow
Dataset
A549 lung cancer cell line (RNA-seq, Reddy 2015):
– Control samples: A549 cell line, untreated, 3 technical replicates
– Treatment samples: A549 cell line, treated with dexamethasone for 4 hours, 4 technical replicates
Epidermal keratinocytes (microarray, accession # GSE26487 in NCBI’s GEO database, Stojadinovic et al, 2011):
– Control sample: Keratinocytes, untreated for 24 hours, technical replicate #1
– Control sample: Keratinocytes, untreated for 24 hours, technical replicate #2
– Treatment sample: Keratinocytes, treated with dexamethasone for 24 hours, technical replicate #1
– Treatment sample: Keratinocytes, treated with dexamethasone for 24 hours, technical replicate #2
Data processing and quality control
During analysis of A549 cell line, we used transcript abundance quantification methods called Salmon (Patro et al. 2017) to estimate abundances without aligning reads, followed by the tximport package for assembling estimated count and offset matrices for use with Bioconductor differential gene expression packages. We then converted the data into DESeqDataSet class and removed the empty rows. For PCA plot and SD-mean plot, we used regularized log transformation to reduce the variance caused by lowly expressed genes.
Before analysis of epidermal keratinocytes, we created plots to assess the quality of the data. Boxplots show differences in probe intensity behavior between arrays. MA plots show to what extent the variability in expression depends on expression level. To remove such dependency, we conducted normalization on the data. The standard method for normalization is RMA. The RMA method proceeds with background subtraction, normalization and summarization using a deconvolution method for background correction and quantile normalization, and the RMA (robust multi-chip average) algorithm for summarization (Klaus and Reisenauer, 2018).
Differential Expression Analysis
For A549 cell line, differentially expressed genes were determined using the DESeq2 package. False discovery rate threshold was set to 0.05, while log2 fold change threshold was set to 2. Genes were considered differentially expressed if they met both the threshold for adjusted p-value and that for fold change.
For epidermal keratinocytes, differentially expressed genes were determined using the limma package. A linear model was fitted between the control and treatment groups to identify differentially expressed genes. Since data on epidermal keratinocytes used the same set of biological replicates in the control as in the treatment groups, sample bias was also limited in this way. Genes were considered differentially expressed if the p-value adjusted to multiple testing fell below 0.05.
Hierarchical Clustering
With distance between each pair of samples computed, we needed the hierarchical clustering algorithm to join these samples into groups. Heatmaps are ubiquitous in genomics literature. They are generally used to represent the varying levels of gene expression across samples. We created our heatmaps using an R package called pheatmap, which stands for “Pretty Heatmaps” (Kolde 2018). This package creates clustered heatmaps and offers control over heatmap appearance and dimensions.
Principle component analysis
Principal component analysis (PCA) is a mathematical algorithm that reduces the dimensionality of the data. It accomplishes this reduction by identifying directions, called principal components, along which the variance in data is maximal. We performed principal component analysis on genes differentially expressed in epidermal keratinocytes and A549 cell line treated by dexamethasone, with respect to the control cells. We used the prcomp method in R, extracted the first two principal components, and determined the amount of variance between the treatment and control groups, for both A549 cell line and epidermal keratinocytes.
Results
Data cleaning and preprocessing
Prior to analyzing the datasets, we needed to ensure that our data was preprocessed to the same state, so that we could move on to the next steps without fear of bias. For Salmon’s quantified genes from A549 cell line, we first removed the empty rows. We found, from the result, that 12,360 empty rows existed, and by removing them, 37,361 rows remained. Afterwards, regularized log transformation was applied to reduce the variance on lowly expressed genes. We could now visualize the control and treatment representations upon applying the rlog transformation method. In Figure 2 (a), we clearly observed that the samples could be clustered by control and treatment conditions. PCA plot (Figure 2 (b)) of the data also shows that PC1 could easily separate our treatment and control groups, explaining 87% of the variance in data.
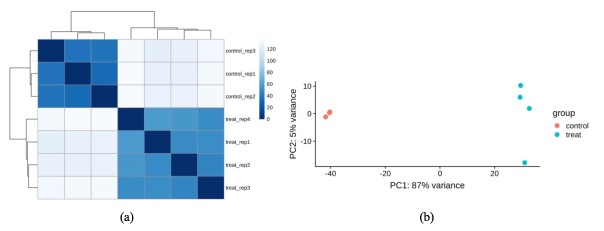
Figure 2.(a) Heatmap of distances between samples in A549 cell line; (b) PCA plot of control and treated samples in A549 cell line
In epidermal keratinocytes, we first obtained a heatmap representation of the sample-to-sample distance (data not shown). Upon finding that samples did not strongly cluster by control and treatment conditions, we normalized the data to make conditions more consistent for comparison among all samples. Figure 3 shows the heatmap of sample-to-sample distance after normalization, in which based on the colors shown, some distinctions in expression levels could now be seen between control samples and samples treated with dexamethasone.
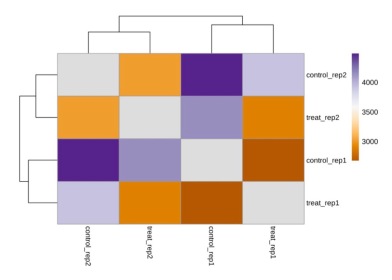
Figure 3. Heatmap of sample-to-sample distance after normalization for epidermal keratinocytes
With normalization carried out, we noticed from the boxplot in Figure 4 that the mean and variance of our control and treatment groups became more consistent upon normalization. In Figure 5, PCA plot indicated that we could separate control from treatment groups along the second PC axis after normalization.
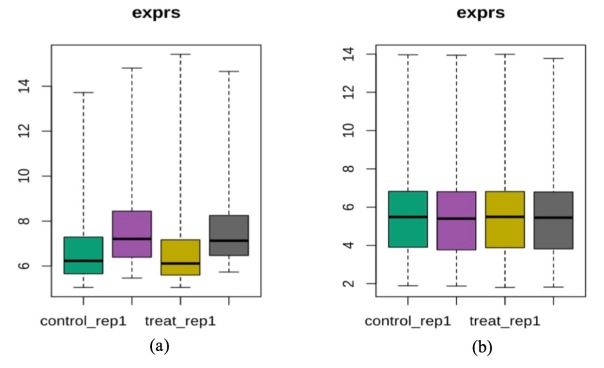
Figure 4. Boxplots before and after normalization for epidermal keratinocytes
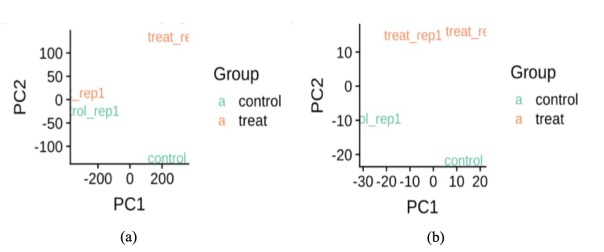
Figure 5. (a) PCA plot of raw data for epidermal keratinocytes; (b) PCA plot of the normalized data
Differential Expression Analysis
A549 cell line:
We ran the differential expression pipeline on the A549 cell line and obtained log2fold (LFC) changes and p-values for the gene list. We set the adjusted p-value cutoff to 0.05. Now, the output result in Table 1 showed that at a false discovery rate (FDR) of 5%, 22% of the genes were up-regulated, while 21% were down-regulated, out of 25,001 genes.
| Condition | Read count | Percentage |
| LFC > 0 (up-regulated) | 5536 | 22% |
| LFC < 0 (down-regulated) | 5371 | 21% |
| Outliers | 54 | 0.22% |
| Low counts | 5817 | 23% |
Table 1. Gene overview at a false discovery rate (FDR) of 5% for A549 cell line
We examined the fold change distribution induced by treatment in an MA-plot and a histogram of the p-values (Figure 6). In the MA-plot, each gene is represented as a dot, and specific genes with p-values under 0.05 are shown in red. Also, the histogram is consistent with Table 1 in that more than 10,000 genes exhibited significant change, with p-values less than 0.05, after treatment with dexamethasone under the p-value test.
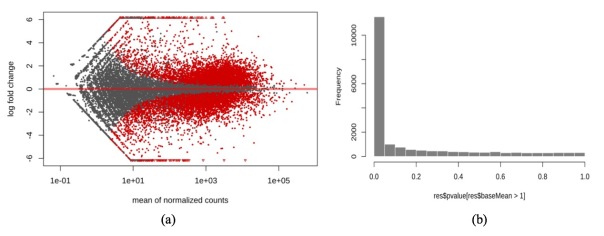
Figure 6. (a) MA plot of mean of normalized count against fold change in A549 cell line; (b) histogram of p-values in A549 cell line
Epidermal keratinocytes:
A large number of probes displayed expression intensities in the background range for the epidermal keratinocytes. Thus, without preprocessing, we could not easily detect real changes across the array. The first step involved removing the data with low variance in the background range of intensity. By doing so, we could filter the data that may contribute to false positive results. In Figure 7, the red bar denotes threshold value separating out the low and high intensities. If more than two samples of a gene had intensities higher than the threshold value, the gene would be kept, deemed to have higher than background intensities. We could then observe that 8,565 out of 12,625 genes had higher expression values than the threshold (Table 2).
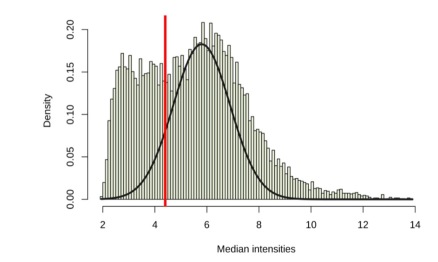
Figure 7. Histogram of median intensities in epidermal keratinocytes
| Not selected | Selected | |
| Gene counts | 4060 | 8565 |
Table 2. Genes selected for further differential expression analysis based on the threshold expression intensity
Identification of differentially expressed genes
In A549 cell line, based on previous observations, we selected the genes that had adjusted p-values below 0.05, and ordered them by their fold changes.
With at least hundreds of genes being differentially expressed, we were interested in finding the ones with relatively large fold changes. We selected the genes with absolute log2 fold changes higher than 2. Figure 8 shows a histogram of the log2 fold change distribution in genes with adjusted p-value lower than 0.05. Yellow bars denote genes with fold changes less than 2, which were thus filtered. After this filtering, 10,907 genes remained and were selected for further study of possible differential expression, out of what originally amounted to 25,001 genes.
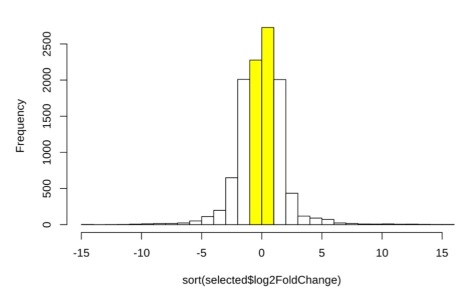
Figure 8. Histogram of selected genes with log2 fold changes
Analysis of epidermal keratinocytes:
In limma package, we could apply t-test or ANOVA to identify differential expression in epidermal keratinocytes. In this package, we could fit a linear model to the expression data of each gene. Considering batch effects between replicates, we first created a matrix to remove them. Afterwards, we applied this linear model and computed moderated t–statistics by calling the eBayes() function. The eBayes() function would compute a t-statistic and a corresponding p-value for each gene.
Upon fitting the model, we visualized the distribution of p-values and log2 fold changes in a volcano plot, Figure 9 (a), to determine model quality. Figure 9 (b) shows a histogram of p-value distribution — the peak near zero indicates an abundance of p-values smaller than 0.05, corresponding to genes likely to be differentially expressed from dexamethasone treatment. Due to a large number of genes having p-values within 0.05, we increased our stringency in avoiding false positive results by setting the adjusted p-value cutoff to 0.05, without setting a cutoff for either the fold change or the true p-value.
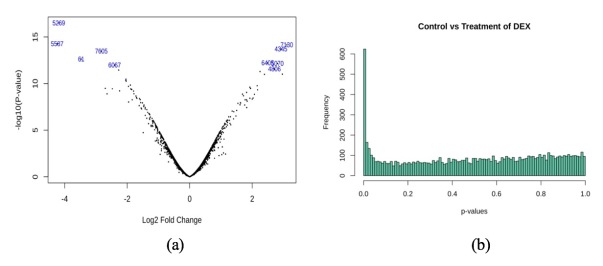
Figure 9. (a) Distribution of fold changes and p-values from epidermal keratinocytes in a Volcano plot; (b) histogram of p-value distribution from epidermal keratinocytes
Table 3 below shows the number of differentially expressed genes with p-values within 0.001 and adjusted p-values within 0.05.
| P value | Insignificant | Significant |
| 0.05 (Adjusted p-value) | 8,117 | 448 |
| 0.001 | 8,205 | 360 |
Gene clustering
A549 cell line:
We obtained a heatmap to show the hierarchical clustering of differentially expressed genes. Rather than using absolute expression strengths, we plotted the heatmap by deviation of each gene’s expression in a specific sample from the average across all samples. It is seen in Figure 10 (a) that control and treated samples were clearly separated, and the genes were divided into two clusters. Genes in the top cluster were mostly up-regulated genes, appearing in higher levels of expression with dexamethasone treatment than without. Genes in the bottom cluster were mostly down-regulated genes with lower expression levels after treatment. As well, we were interested in genes with largest expression changes after treatment with dexamethasone. Figure 10 (b) shows the top 30 genes that were likely most affected by dexamethasone treatment. These genes showed the highest variance across all samples, where most of these genes were up-regulated from control through treatment with dexamethasone.
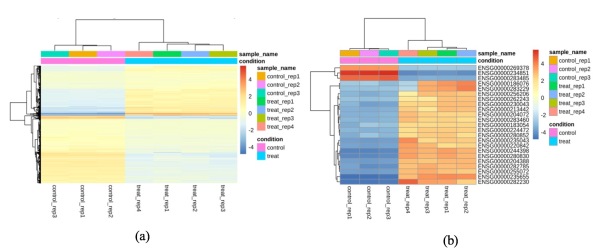
Figure 10. (a) Heatmap of genes across all samples in A549 cell line; (b) heatmap of genes with the highest variance across all samples in A549 cell line
Epidermal keratinocytes:
For epidermal keratinocytes, we could roughly divide the genes into three clusters, in which control and treated samples were clearly separated. In Figure 11, we could also observe that the gene cluster near the top showed comparatively high expression levels, whether those genes fell into control or treatment groups. Gene cluster near the middle showed comparatively low expression levels upon dexamethasone treatment. Relatively speaking, gene cluster near the bottom showed a mixture of low and high expression levels from the treatment.
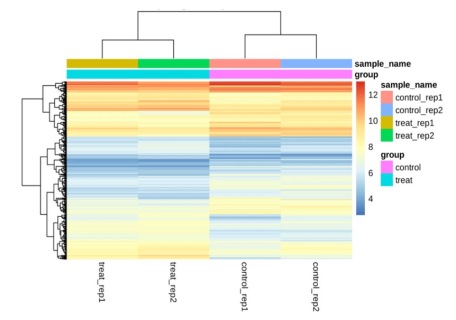
Figure 11. Heatmap of genes across all samples for epidermal keratinocytes
PCA plot
After gene selection, we analyzed the genes with PCA plots. Figure 12 (a) shows the selected genes in A549 cell line. It is clear that those genes can be separated into two parts by the second PC axis. Since we filtered out the genes with low fold changes, the second PC axis aligned with fold changes shown earlier in an MA plot, with the two clusters being up-regulated and down-regulated genes. As shown in Figure 12 (b), second PC axis readily separated the genes from epidermal keratinocytes into two clusters as well.
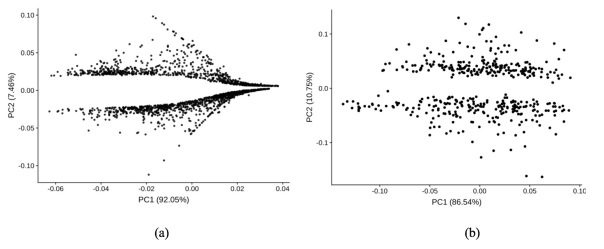
Figure 12. (a) PCA plot of genes in A549 cell line; (b) PCA plot of genes in epidermal keratinocytes
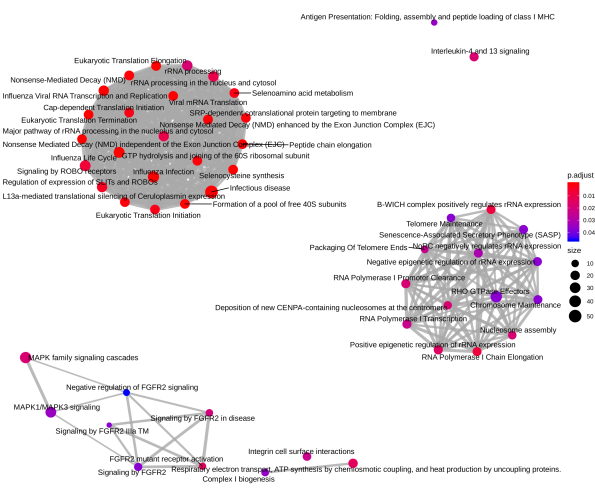
Pathway Analysis
Below is a diagram of the pathway clusters for differentially expressed genes in A549 cell line:
Below is a diagram of the pathway clusters for differentially expressed genes in epidermal keratinocytes:
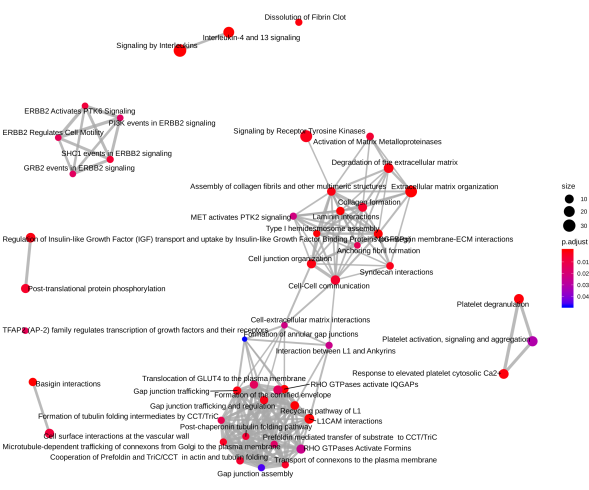
Diagrams on pathway clusters shown above for our two datasets were drawn using the ReactomePA package from R (Yu and He, 2016).
Many of the differentially expressed genes in either of the two datasets fell either into cancer-related pathways or into pathways dealing with immune systems. As seen in the clusters of enriched pathways above, interleukin 4/13 (IL 4/13) signaling pathways are present in both the A549 lung cancer cell line and the epidermal keratinocytes. Literature searches on the two signaling pathways reveal that these pathways are related to tumor growth and immune response. This is consistent with our finding of enriched pathways being mostly those dealing with cancer and immune systems.
More Detailed Literature Survey
Finally, we searched further into literature on the potential effects of dexamethasone treatment on IL-4/13 signaling. IL-4/13 serve as important signaling molecules in human’s immune system. These molecules bear relations with adaptive immune response (Waters et al, 2018), inflammation, allergic response (Gour and Wills-Karp, 2015), and tumor growth (Kawakami et al, 2002).
Studies from Tomita et al. (1999) show that dexamethasone suppresses gene expression and production of IL-13 molecules by human mast cell line and lung mast cells. This agrees with our pathway analysis that also shows IL-13 signaling to be an enriched pathway for the A549 data dealing with lung cancer cells.
Discussion and Conclusion
From our findings, we came to the following conclusions:
- A549 lung cancer cell line showed far more significant response to dexamethasone treatment than epidermal keratinocytes, upon comparing the numbers of differentially expressed genes from dexamethasone treatment between the two datasets.
- Interleukin 4/13 (IL 4/13) signaling pathway was found to be enriched in both epidermal keratinocytes and A549 cell line.
- Both similarities and differences thus exist in how the two cell types respond to dexamethasone treatment, despite the two cell types themselves being highly different from each other.
- Dexamethasone can, hence, affect cells of widely different types in a human body.
Lists of Differentially Expressed Genes
Below is a list of top ten differentially expressed genes from epidermal keratinocytes, upon treatment with dexamethasone:
| Gene ID | Symbol | Gene name | log2(fold change) | p-value | Adjusted p-value |
| 37989_at | PTHLH | parathyroid hormone like hormone | -4.19 | 0.0e+00 | 0.00 |
| 38428_at | MMP1 | matrix metallopeptidase 1 | -4.24 | 0.0e+00 | 0.00 |
| 40522_at | GLUL | glutamate-ammonia ligase | 3.11 | 0.0e+00 | 0.00 |
| 36629_at | TSC22D3 | TSC22 domain family member 3 | 2.92 | 0.0e+00 | 0.00 |
| 41193_at | DUSP6 | dual specificity phosphatase 6 | -2.83 | 0.0e+00 | 0.00 |
| 1081_at | ODC1 | ornithine decarboxylase 1 | -3.47 | 0.0e+00 | 0.00 |
| 39528_at | RRAD | RRAD, Ras related glycolysis inhibitor and calcium channel regulator | 2.50 | 0.0e+00 | 0.00 |
| 37701_at | RGS2 | regulator of G protein signaling 2 | 2.81 | 0.0e+00 | 0.00 |
| 39070_at | FSCN1 | fascin actin-bundling protein 1 | -2.41 | 0.0e+00 | 0.00 |
| 37324_at | TFRC | transferrin receptor | 2.71 | 0.0e+00 | 0.00 |
Below is a list of top ten differentially expressed genes from A549 cell line, upon treatment with dexamethasone:
| Gene ID | Symbol | Base mean | log2(FC) | p-value | log10(p-value) | Adj. p-value | log10(adj. p-value) |
| ENSG00000235655 | NA | 3077 | 15.6 | 0.00 | -37.8 | 0.00 | -36.5 |
| ENSG00000282230 | ADAM9 | 2889 | 15.6 | 0.00 | -27.7 | 0.00 | -26.6 |
| ENSG00000244398 | NA | 1582 | 14.7 | 0.00 | -34.3 | 0.00 | -33.0 |
| ENSG00000283485 | NA | 3148 | -14.7 | 0.00 | -45.6 | 0.00 | -44.1 |
| ENSG00000280830 | ADI1 | 1388 | 14.5 | 0.00 | -33.2 | 0.00 | -32.0 |
| ENSG00000234851 | NA | 1.20×10^4 | -14.2 | 0.00 | -83.0 | 0.00 | -81.0 |
| ENSG00000235043 | NA | 803 | 13.7 | 0.00 | -23.4 | 0.00 | -22.4 |
| ENSG00000204388 | HSPA1B | 737 | 13.6 | 0.00 | -29.6 | 0.00 | -28.5 |
| ENSG00000255072 | PIGY | 732 | 13.6 | 0.00 | -29.3 | 0.00 | -28.2 |
| ENSG00000220842 | NA | 659 | 13.4 | 0.00 | -24.5 | 0.00 | -23.5 |
Source code
The full source code to conduct this study is available at https://github.com/H3K4me3/code6150. The results are also available as reports at https://h3k4me3.github.io/code6150/microarray_explore.html and https://h3k4me3.github.io/code6150/rnaseq_explore.html.
Reference
- A549 cell. (2018, June 27). Retrieved November 9, 2018, from https://en.wikipedia.org/wiki/A549_cell
- Bordag, N., Klie, S., Jurchott, K., Vierheller, J., Schiewe, H., Albrecht, V., . . . Selbig, J. (2015). Glucocorticoid (dexamethasone)-induced metabolome changes in healthy males suggest prediction of response and side effects. Scientific Reports, 1-12. https://doi.org/10.1038/ srep15954(2015)
- Gour, N., & Wills-Karp, M. (2015). IL-4 and IL-13 signaling in allergic airway disease. Cytokine,75(1), 68-78. https://doi.org/10.1016/j.cyto.2015.05.014
- Kawakami, M., Kawakami, K., Stepensky, V. A., Maki, R. A., Robin, H., Muller, W., . . . Puri, R. K. (2002). Interleukin 4 receptor on human lung cancer. Clinical Cancer Research, 8(11), 3503-3511.
- Keratinocyte. (2018, July 18). Retrieved November 9, 2018, from https://en.wikipedia.org/wiki/Keratinocyte
- Klaus, B., & Reisenauer, S. (2018, September 14). An end to end workflow for differential gene expression using Affymetrix microarrays. In Bioconductor. Retrieved November 9, 2018, from https://www.bioconductor.org/packages/devel/workflows/vignettes/maEndToEnd/inst/doc/MA-Workflow.html
- Kolde, R. (2018). Package ‘pheatmap‘.
- Reddy, T. (2015, March 16). ENCBS527MAH / cell line. Retrieved November 9, 2018, from https://www.encodeproject.org/biosamples/ENCBS527MAH/
- Stojadinovic, O., Lee, B., Vouthounis, C., Vukelic, S., Pastar, I., Blumenberg, M., . . . Tomic-Canic, M. (2011, January 7). Effects of glucocorticoids in epidermal keratinocytes. Retrieved November 9, 2018, from https://www.ncbi.nlm.nih.gov/geo/query/acc.cgi?acc=GSE26487
- Tomita, M., Itoh, H., Kobayashi, T., Onitsuka, T., & Nawa, Y. (1999). Expression of mast cell proteases in rat lung during helminth infection: mast cells express both rat mast cell protease II and tryptase in helminth infected lung. International Archives of Allergy and Immunology, 120(4), 303-309. https://doi.org/10.1159/000024283
- Waters, R. S., Perry, J. S. A., Han, S., Bielekova, B., & Gedeon, T. (2018). The effects of interleukin-2 on immune response regulation. Mathematical Medicine and Biology, 1-52. https://doi.org/10.1093/imammb/dqw021
- Yu, G., & He, Q.-Y. (2016). ReactomePA: An R/Bioconductor package for reactome pathway analysis and visualization. Molecular BioSystems, (2), 477-479. https://doi.org/10.1039/C5MB00663E
