Author Archives: Sothivin
Exome Sequence Analysis of Rare Variants
Shivin Madivanan, Kaitlyn Fragogiannis, and Sothivin Lanh
OBJECTIVE
The objective of this study was to investigate significant variants among an individual’s exome sequence data. Upon identifying top variants that had low frequency based off of data from the 1000 Genomes Project and had particularly detrimental effects, we analyzed six of these variants to characterize their effects on their respective genes and proteins as well as identify diseases associated with them.
METHODOLOGY
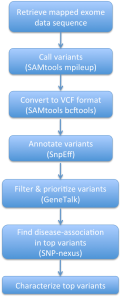
Initially, we retrieved a mapped exome sequence from the 1000Genomes Project database for a Han Chinese individual from Beijing, China. Using this exome data, we attempted to use SAMtools mpileup and bcftools to call any SNP variants in the exome, in comparison to the GRCh37 hg19 reference sequence obtained from the 1000Genomes Project site, and write these variant calls into a VCF file. However, we later found that the computation required more computer memory than any of our members had on our personal computers.
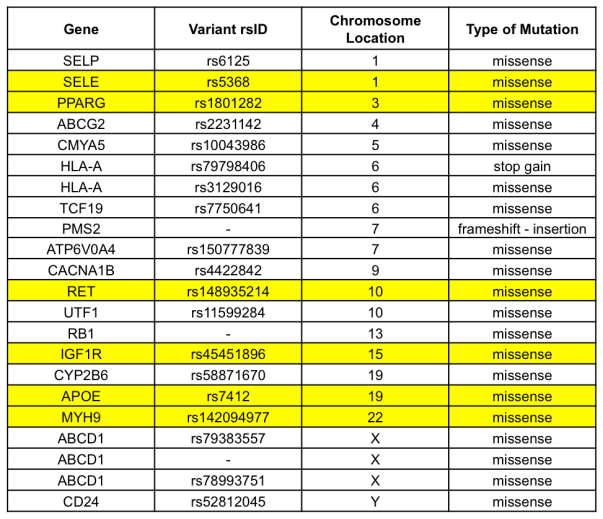
Therefore, we had to work with an alternative exome sequence obtained from the Personal Genome Project in lieu of performing the aforementioned steps. This alternative data file was for a Caucasian male from the United States and already had the variants called and written into the VCF format. We found that there were about 170,000 total variants from this individual. Using this VCF file, we used the SnpEff tool to annotate the variants and predict the effects that these variants had on any genes and their respective proteins. Afterwards, we filtered annotated variants using GeneTalk to determine the most detrimental variants and prioritized for rare variants that had pathogenic attributes. After filtering and prioritization, we narrowed our variant list from 170,000 total variants to 22 top significant variants. Later, we used SNP-nexus to determine top variants that were associated to diseases. From this list, we chose six variants to characterize.
VARIANT CHARACTERIZATION
SELE (rs5368)
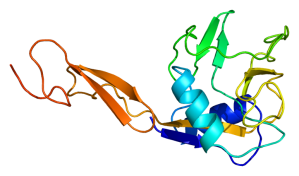
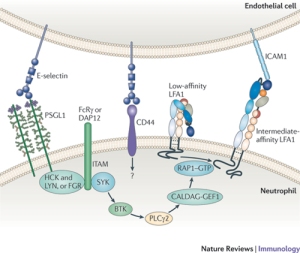
The SELE gene codes for the E-selectin protein, also known as endothelial leukocyte adhesion molecule-1. This is a cell adhesion molecule that operates within cytokine-stimulated endothelial cells (Collins et al. 1991). It is integral in the inflammation reaction of humans, where it facilitates the accumulation of blood leukocytes to an inflammation site by mediating the adhesion of cells to the vascular lining. E-selectin is expressed when damaged cells release cytokines. E-selectin binds to leukocytes and allows the leukocytes to bind to the endothelial surface of damaged tissue and proceed into the tissue (Robbins et al. 1999).
The rs5368 variant that we found in our exome analysis is located on the chromosome 1 at position 169696946. This variant had a gene quality score of 99.0 and depth of read of 115. Also, this single nucleotide polymorphism has a frequency of 53/6008 (0.882%) based off of the data from the 1000Genomes Project and Exome Sequencing Project, which suggests that the variant is rare. This specific SNP variant is a non-synonymous missense mutation that replaces the normal cytosine with a thymine, which causes a His-to-Tyr amino acid change during translation. This particular missense variant is known to occur in exon 9 of the SELE gene, which suggests it has a significantly adverse effect on the function of the protein (Maxwell and Wang 2006). As such, it has been studied to produce pathogenic phenotypic changes, such as its associated with IgA nephropathy (Maxwell and Wang 2006).
According to previous literature, the E-selectin protein has been found to be related to inflammatory diseases and cancer. In regards to inflammation, E-selectin has been suggested to produce harmful effects in relation to chronic inflammation. For example, it has been studied to be associated with the development of vulnerable plaques of acute coronary syndrome (Fang et al. 2011). In regards to cancer, cancerous cells infiltrate the inflammatory system by interacting with selectins, where E-selectin, specifically, mediates the adhesion of cancer cells to endothelial cells. Ultimately, this interaction facilitates metastatic dissemination of the cancer (Nicolson 1988; Wang et al. 2001). Furthermore, the rs5368 polymorphism is related to susceptibility to respiratory diseases. It has been found in relation to Chinese worker pneumoconiosis (Wang et al. 2013) as well as respiratory syncytial virus in children (Krueger et al. 2006). It also seems to be associated IgA nephropathy which is a disease of the kidney (Maxwell and Wang 2006). All of this provides evidence that E-selectin, as well as the mutations that affect it, has an essential role in normal function of cell adhesion and inflammation reaction. Additionally, the SELE gene is seen to be conserved among other mammalian species and somewhat in non-mammalian species.
PPARG (rs1801282)
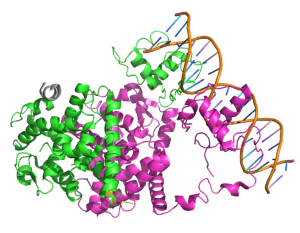
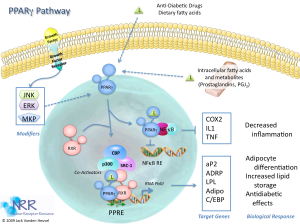
Peroxisome proliferator-activated receptor gamma (PPARG) is a nuclear receptor protein that binds chemicals to induce proliferation of peroxisomes in order to contribute to the oxidation of fatty acids (Michalik et al. 2006). PPARG is expressed primarily in adipose tissue and in the intestine (Fajas et al. 1997). PPARG binds heterodimerically with retinoid X receptors (RXR) to the peroxisome proliferator response elements (Mukherjee et al. 1997). PPARG have both ligand-dependent and ligand-independent activation domains, where insulin stimulates the ligand-independent activation of PPARG (Deeb et al. 1998). Also, PPARG has been identified to repress the transcriptional activation of inflammatory response genes in macrophages (Pascual et al. 2005).
The single nucleotide polymorphism found in our exome analysis was the rs1801282 variant, which occurs at position 12393125 of chromosome 3 within the PPARG gene. This variant had a gene quality score of 99 and a read depth of 83. Based off of data from the 1000Genomes Project and the Exome Sequencing Project, the variant has a frequency of 52/6008 (0.866%), which makes it relatively rare. The rs1801282 variant involves a nucleotide substitution from C to G. This causes a non-synonymous missense mutation, where an alanine is translated instead of a proline. This SNP mutation occurs in the exon B portion of the gene’s DNA sequence, which causes a wide variety of phenotypic changes, such as increased BMI, the development of type 2 diabetes mellitus, higher insulin levels, and lower insulin sensitivity (Valve et al. 1999; Deeb et al. 1998). Thus, it obviously plays an adverse role on the normal, healthy function of the PPARG protein.
Allelic variants in the PPARG gene are associated with a variety of pathogenic phenotypes, such as severe obesity, type 2 diabetes, colon cancer, and lipodystrophy. However, for our particular rs1801282 variant, it is primarily associated with type 2 diabetes. As mentioned previously, this variant can cause a variety of phenotypic changes, which facilitate the development of type 2 diabetes. Since the PPARG gene product is a nuclear receptor that is involved in the regulation of adipocyte differentiation as well as lipid metabolism and insulin sensitivity, any significant mutation in this gene is very likely to play a role in type 2 diabetes (Yen et al. 1997). Stemming from similar variant mutations in the PPARG gene, the loss of normal adipocyte differentiation could also lead to lipodystrophy, which is characterized by abnormal or degenerative conditions of the body’s adipose tissue due to metabolic abnormalities. Lipodystrophy is also related to diabetes, since it can manifest as a small lump or dent in the skin that forms when a person performs injections repeatedly in the same area. In summary, normal function of the PPARG gene is essential in regulating fatty acid storage in adipose tissue and metabolism. Additionally, the PPARG gene is seen to be conserved among other mammalian species.
RET (rs148935214)
The “rearranged during transfection” (RET) protooncogene is a type of receptor tyrosine kinase, which is a cell-surface molecule responsible for transducing signals for cell growth and differentiation. This specific receptor tyrosine kinase acts for members of the glial cell line-derived neurotrophic factor (GDNF) family of extracellular signaling molecules/ligands (Knowles et al. 2006; Baloh et al. 2006). RET plays an important role in the extracellular domain for signal transduction, such that sufficient levels of expression of RET on the cell surface are necessary for ganglia migration and for full differentiation (Iwashita et al. 1996). RET has also been found to be essential for normal development of the kidneys and the enteric nervous system as well as affecting intestine organogenesis by regulating the development of both the nervous and lymphoid system in the gut (Arighi et al. 2005; Veiga-Fernandes et al. 2007).
From our exome analysis, the single nucleotide polymorphism we found was the rs148935214 variant, which occurs at position 43609994 of chromosome 10 within the RET gene. This variant had a gene quality score of 99 and a read depth of 134. Based off of data from the 1000Genomes Project and the Exome Sequencing Project, the variant has a frequency of 4/5379 (0.074%), which suggests it is extremely rare. The rs148935214 SNP variant involves a nucleotide substitution from C to T. This causes a non-synonymous missense mutation, where a leucine is translated instead of a serine. While this particular variant has not been well-described in previous literature, the entire RET genomic sequence contains 20 exons, which make up over half of the entire size of the gene (Pasini et al. 1995). This fact allows for a statistically more probable chance that a mutation variant will occur in an exonic portion of the gene sequence. As seen from a collection of other studies, there is a large number of mutations that correspond to detrimental phenotypic changes in the normal function of the RET protein, so our variant is relatively likely to be adverse as well (Pelet et al. 1998; Kjaer et al. 2003; Attie et al. 1995; Angrist et al. 1995; Julies et al. 2001).
Allelic variants in the RET gene are associated with a variety of pathogenic phenotypes, such as multiple endocrine neoplasia (types IIA and IIB), medullary thyroid carcinoma, renal agenesis, pheochromocytoma, Hirschsprung’s disease, and central hypoventilation syndrome. For the particular rs148935214 variant that we found in our exome analysis, previous literature does not describe any specific disease with which it is associated. Instead, this variant is suggested to act similarly to other described variants in association with the development or facilitation of any combination of the aforementioned pathogenic phenotypes. For example, Mulligan et al. (1993) found that similar constitutional missense mutations of the RET gene occurred in 20 of 23 distinct multiple endocrine neoplasia IIA families, but not in any of their 23 normal controls. For the most part, other described SNP mutations suggest that the RET gene primarily associated with multiple endocrine neoplasia (types IIA and IIB) and Hirschsprung’s disease. RET’s association with Hirschsprung’s disease, which is characterized by the lack of nerves in the intestines, occurs from loss of function mutations in the gene. Multiple endocrine neoplasia and other cancer types, on the other hand, occur from gain of function mutations in the RET gene, which attributes to its protooncogenic capacity. The other pathogenic phenotypes of RET, such as renal agenesis and central hypoventilation syndrome, occur in relation to these two main phenotypes. Furthermore, the expression of RET has also been studied to have a proapoptotic effect when not inhibited by its GDNF ligand. In summary, normal function of the RET gene, through its function as a receptor tyrosine kinase for GDNF extracellular signaling molecules, is essential in the regulation of nerve cell migration and cell growth and differentiation. Additionally, the RET gene is seen to be loosely conserved among other mammalian species but especially among primates.
IGF1R (rs454511896)
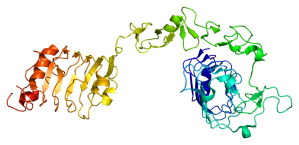
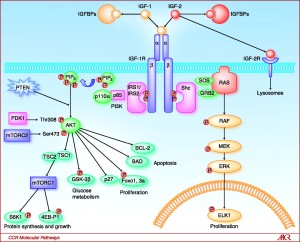
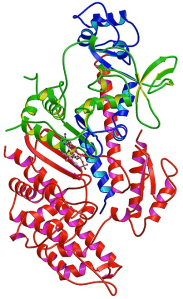
The insulin-like growth factor I receptor (IGF1R) gene codes for a transmembrane protein that is found on the surface of human cells and is activated by the molecule insulin-like growth factor 1. The IGF1R protein is a tyrosine kinase made up of two alpha subunits and two beta subunits and has an ATP binding site, along with its IGF1R ligand binding site (Gregory et al. 2001). The receptor uses ATP to provide the phosphates for tyrosine autophosphorylation of the beta subunit upon activation of the receptor, triggering the signal transduction cascade (Jones et al. 1995). The IGF1R receptor plays a crucial role in cell cycle progression and transformation events and, when activated, the receptor promotes cell survival and cell proliferation (LeRoith et al. 1995).
The variant of the IGF1R gene we obtained from our exome analysis was a single nucleotide polymorphism at position 99459340 on chromosome 15 within the IGF1R gene. This variant is rare, occurring in 5 in 5379 people (0.093%) from data from the 1000Genomes Project and Exome Sequencing Project, and is a non-synonymous missense mutation of arginine to glutamine, due to the nucleotide substitution of G to A. The frequency was based off of data from the 1000 genomes project and the exome sequencing project. Our IGF1R variant has a genotype quality score of 99.0 and depth of read of 79, providing evidence that the variant is real. Variants of this gene has been associated with intrauterine growth (Abuzzahab et al. 2003), subsequent short stature and postnatal growth deficits (Kawashima et al. 2005), as well as mental retardation and microcephaly (Raile et al. 2006), demonstrating that variants of this gene severely affect the structure and/or function of the corresponding protein.
Mutations of the IGF1R gene or factors important in regulating this gene has been implicated in various diseases, predominantly diabetes and cancer. This gene is highly over expressed in cancerous cells where its acts as an anti-apoptotic agent by enhancing cell survival (Warshamana-Greene et al. 2005). Mutations of the tumor suppressor gene p53 are also common in malignant tissues, being the most frequently mutated gene in cancer. p53 is a nuclear transcription factor that regulates the IGF1R gene, inhibiting transcription of this gene and leading to subsequent inhibition of cell cycle progression and inducement of apoptosis (Werner 1996). If p53 is mutated so that it can no longer suppress the IGF1R receptor or if the IGF1R receptor is mutated so it’s always “on” the signal transduction cascade will be continuously occurring, triggering the constant cell cycle progression and transformation observed in cancer. The association between mutations of IGF1R gene and various diseases provides evidence that the corresponding IGF1R protein has a critical function in the cell. Additionally, the IGF1R gene is seen to be highly conserved among mammals.
APOE (rs7412)
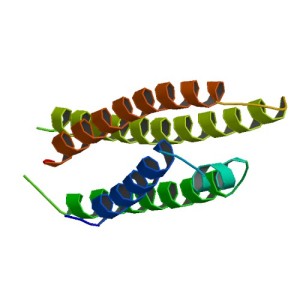
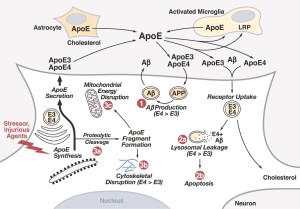
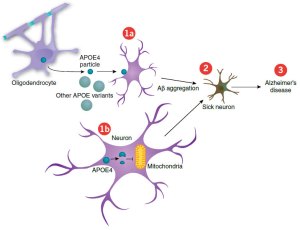
APOE is a gene that codes for Apolipoprotein E (ApoE). Apolipoporotein E functions to bind triglyeride-rich lipoprotein constituents and aid in its normal catabolism. It primarily functions by transporting lipoproteins, fat-soluble vitamins, and cholesterol into the lymph system and later into the blood. Among peripheral tissues, ApoE is predominantly produced by the liver to facilitate cholesterol metabolism. Additionally, ApoE is particularly important in the central nervous system, where it is produced primarily by astroglia and microglia and is used to transport cholesterol lipids to neurons via their ApoE receptors (Huang et al. 2004; Mahley and Rall 2002). ApoE is a part of the low-density lipoporoteins receptor gene family, which is highly conserved in mammals.
The rs7412 variant that we found from our exome analysis is located on position 45412079 of chromosome 19. This variant had a frequency of 24/4657 (0.515%) based off of data from the 1000Genomes Project and Exome Sequencing Project, which suggests that the variant is rare. The gene quality score of this single nucleotide polymorphism was 99, and the depth of the read was 136. This particular SNP mutation is a non-synonymous missense mutation that causes the normal cytosine to be switched with a thymine, which results in a Arg-to-Cys amino acid substitution during translation. This particular missense variant is the major isoform of the ApoE2 protein isoform, where both the ApoE2 isoform along with its Arg-to-Cys mutated isoform have been found to cause poor binding ability of the protein to its cell surface receptors (Weisgraber et al. 1982). As a result, the variant has been demonstrated to cause various pathogenic phenotypes. For example, Sullivan et al. (1998) established that the SNP mutation is able to cause type III hyperlipoproteinemia and spontaneous atherosclerosis.
According to previous literature, the ApoE protein is associated in a variety of diseases, such as type III hyperlipoproteinemia, Alzheimer’s disease, lipoprotein glomerulopathy, sea-blue histiocyte disease, and myocardial infarction. However, studies have primarily focused on its involvement with type III hyperlipoproteinemia and Alzheimer’s disease specifically. The rs7412 variant has been identified particularly to be associated with type III hyperlipoproteinemia, which is characterized by increased LDL, cholesterol, and triglyceride levels as well as decreased HDL levels and may eventually lead to various vascular diseases (Emi et al. 1988). Furthermore, other variant isoforms of the ApoE protein have also been studied for their strong correlation with the development of Alzheimer’s disease (Alexander et al. 2007). The ApoE proteins normally functions to catalyze the breakup of a particular molecule called beta amyloid (Aβ). Alzheimer’s disease is characterized by high beta amyloid build up, and people with this SNP mutation in the APOE gene have a ApoE protein that is less effective in breaking down these beta amyloid molecules. This SNP has also been found to be associated with osteoporosis as well as obstructive sleep apnea in children (Singh et al. 2010; Kalra et al. 2007). Additionally, the APOE gene is seen to be conserved primarily among primates with some conservation with other mammalian species.
MYH9 (rs142094977)
The myosin heavy chain 9 non-muscle gene codes for the protein known as myosin-9, which is a subunit of the larger protein, myosin IIA (Hodge 2000). Myosin IIA contains two heavy chains with head and tail regions and four light chains. The head region of the heavy chains interacts with actin, while the tail regions interact with other proteins (Tyska et al. 2002). Myosins are a family of motor proteins dependent on ATP and their structure and function is highly conserved across species. Myosin II proteins are responsible for muscle contraction in muscle cells, and myosin IIA, along with the closely related myosin IIB and myosin IIC proteins, has a role specifically in cell motility, maintenance of cell shape through its regulation of actin in the cytoskeleton, and cytokinesis in cell division (Pollard et al. 1973).
The variant of the MYH9 gene we obtained from our exome analysis was a single nucleotide polymorphism at position 36682873 on chromosome 22 within the MYH9 gene. This variant is rare, occurring in 13 in 5379 people (0.24%) from data from the 1000Genomes Project and Exome Sequencing Project, and is a non-synonymous missense mutation of methionine to threonine, due to the nucleotide substitution of T to C. The frequency was based off of data from the 1000 genomes project and the exome sequencing project. Our MYH9 variant has a genotype quality score of 99.0 and depth of read of 96, providing evidence that the variant is real. Variants of this gene have been associated with May-Hegglin anomaly (Deutsch et al. 2003), Fechtner Syndrome Consortium (Cusano et al. 2000), as well as Epstein Syndrome (Arrondel et al. 2002), demonstrating that variants of this gene severely affect the structure and/or function of the corresponding protein.
Mutations of the MYH9 gene have been implicated in various diseases, including Fechtner Syndrome, May-Hegglin Anomaly, and Sebastian Syndrome. All of these diseases share three characteristics: thrombocytopenia, large platelets, and characteristic leukocyte inclusions known as Dohle-like bodies (May-Hegglin/Fechtner Syndrome Consortium 2000). The loci corresponding to these diseases share an overlapping region of 480 kb on chromosome 22, which suggests that the three disorders may be allelic. MYH9 has been identified as a candidate gene since it is expressed in platelets, upregulated during granulocyte differentiation, and demonstrated to result in pathogenic phenotypes of these diseases when mutated (Seri et al. 2003). The association between mutations of the MYH9 gene and various diseases provides evidence that the corresponding MYH9 protein has a critical function in the cell. Additionally, the MYH9 gene is seen to be highly conserved among mammals.
NOTE: Click on the figure images to be redirected to larger versions of the figures.
REFERENCES
-
Abuzzahab, M. J., Schneider, A., Goddard, A., Grigorescu, F., Lautier, C., Keller, E., Kiess, W., Klammt, J., Kratzsch, J., Osgood, D., Pfaffle, R., Raile, K., Seidel, B., Smith, R. J., Chernausek, S. D. 2003. IGF-I receptor mutations resulting in intrauterine and postnatal growth retardation. New Eng. J. Med. 349: 2211-2222.
-
Alexander et al. 2007. The contribution of apolipoprotein E alleles on cognitive performance and dynamic neural activity over six decades. Biological Psychology 75: p. 229.
-
Angrist, M., Bolk, S., Thiel, B., Puffenberger, E. G., Hofstra, R. M., Buys, C. H. C. M., Cass, D. T., Chakravarti, A. 1995. Mutation analysis of the RET receptor tyrosine kinase in Hirschsprung disease. Hum. Molec. Genet. 4: 821-830.
-
Arighi E, Borrello MG, Sariola H. 2005. RET tyrosine kinase signaling in development and cancer. Cytokine Growth Factor Rev. 16(4–5): 441–67.
-
Arrondel, C., Vodovar, N., Knebelmann, B., Grunfeld, J.-P., Gubler, M.-C., Antignac, C., Heidet, L. 2002. Expression of the nonmuscle myosin heavy chain IIA in the human kidney and screening for MYH9 mutations in Epstein and Fechtner syndromes. J. Am. Soc. Nephrol. 13: 65-74.
-
Attie, T., Pelet, A., Edery, P., Eng, C., Mulligan, L. M., Amiel, J., Boutrand, L., Beldjord, C., Nihoul-Fekete, C., Munnich, A., Ponder, B. A. J., Lyonnet, S. 1995. Diversity of RET proto-oncogene mutations in familial and sporadic Hirschsprung disease. Hum. Molec. Genet. 4: 1381-1386.
-
Baloh, R.H., Enomoto, H. et al. 2000. The GDNF family ligands and receptors – implications for neural development. Curr. Opin. Neurobiol. 10(1): 103–10.
-
Collins T, Williams A, Johnston GI, Kim J, Eddy R, Shows T, Gimbrone MA, Bevilacqua MP. 1991. Structure and chromosomal location of the gene for endothelial-leukocyte adhesion molecule 1. J. Biol. Chem. 266(4): 2466–73.
-
Cusano, R., Gangarossa, S., Forabosco, P., Caridi, G., Ghiggeri, G. M., Russo, G., Iolascon, A., Ravazzolo, R., Seri, M. 2000. Localisation of the gene responsible for Fechtner syndrome in a region less than 600 Kb on 22q11-q13. Europ. J. Hum. Genet. 8: 895-899.
-
Deeb, S. S., Fajas, L., Nemoto, M., Pihlajamaki, J., Mykkanen, L., Kuusisto, J., Laakso, M., Fujimoto, W., Auwerx, J. 1998. A pro12ala substitution in PPAR-gamma-2 associated with decreased receptor activity, lower body mass index and improved insulin sensitivity. Nature Genet. 20: 284-287.
-
Deutsch, S., Rideau, A., Bochaton-Piallat, M. L., Merla, G., Geinoz, A., Gabbiani, G., Schwede, T., Matthes, T., Antonarakis, S. E., Beris, P. 2003. Asp1424Asn MYH9 mutation results in an unstable protein responsible for the phenotypes in May-Hegglin anomaly/Fechtner syndrome. Blood 102: 529-534.
-
Emi, M., Wu, L. L., Robertson, M. A., Myers, R. L., Hegele, R. A., Williams, R. R., White, R., Lalouel, J.-M. 1988. Genotyping and sequence analysis of apolipoprotein E isoforms. Genomics 3: 373-379.
-
Fajas L, Auboeuf D, Raspé E, Schoonjans K, Lefebvre AM, Saladin R, Najib J, Laville M, Fruchart JC, Deeb S, Vidal-Puig A, Flier J, Briggs MR, Staels B, Vidal H, Auwerx J. 1997. The organization, promoter analysis, and expression of the human PPARgamma gene. J. Biol. Chem. 272(30): 18779–89.
-
Fang F, Zhang W, Yang L, Wang Z, Liu DG. 2011. [PECAM-1 and E-selectin expression in vulnerable plague and their relationships to myocardial Leu125Val polymorphism of PECAM-1 and Ser128Arg polymorphism of E-selectin in patients with acute coronary syndrome]. Zhonghua Xin Xue Guan Bing Za Zhi (in Chinese) 39(12): 1110–6.
-
Gregory CW, DeGeorges A, Sikes RA (2001). “The IGF axis in the development and progression of prostate cancer”. Recent Research Developments in Cancer: 437–462.
-
Hodge, Tony; Cope, M. Jamie T. V. 2000. A myosin family tree. Journal of Cell Science 113 (19): 3353–4.
-
Huang Y, Weisgraber KH, Mucke L, Mahley RW. 2004. Apolipoprotein E: diversity of cellular origins, structural and biophysical properties, and effects in Alzheimer’s disease. J. Mol. Neurosci. 23(3): 189–204.
-
Iwashita, T., Murakami, H., Asai, N., Takahashi, M. 1996. Mechanism of Ret dysfunction by Hirschsprung mutations affecting its extracellular domain. Hum. Molec. Genet. 5: 1577-1580.
-
Jones JI, Clemmons DR (February 1995). “Insulin-like growth factors and their binding proteins: biological actions”. Endocr. Rev. 16 (1): 3–34.
-
Julies, M. G., Moore, S. W., Kotze, M. J., du Plessis, L. 2001. Novel RET mutations in Hirschsprung’s disease patients from the diverse South African population. Europ. J. Hum. Genet. 9: 419-423.
-
Kalra et al. 2007. Association of ApoE genetic variants with obstructive sleep apnea in children. Sleep Medicine 9: p. 260.
-
Kawashima, Y., Kanzaki, S., Yang, F., Kinoshita, T., Hanaki, K., Nagaishi, J.-i., Ohtsuka, Y., Hisatome, I., Ninomoya, H., Nanba, E., Fukushima, T., Takahashi, S.-I. 2005. Mutation at cleavage site of insulin-like growth factor receptor in a short-stature child born with intrauterine growth retardation. J. Clin. Endocr. Metab. 90: 4679-4687.
-
Kjaer, S., Ibanez, C. F. 2003. Intrinsic susceptibility to misfolding of a hot-spot for Hirschsprung disease mutations in the ectodomain of RET. Hum. Molec. Genet. 12: 2133-2144.
-
Knowles PP, Murray-Rust J, Kjaer S, Scott RP, Hanrahan S, Santoro M, Ibáñez CF, McDonald NQ. 2006. Structure and chemical inhibition of the RET tyrosine kinase domain. J. Biol. Chem. 281(44): 33577–87.
-
Krueger et al. 2006. Genetic polymorphisms of adhesion molecules in children with severe RSV-associated diseases. International Journal of Immunogenetics 33: p. 233.
-
LeRoith D, Werner H, Beitner-Johnson D, Roberts CT (April 1995). “Molecular and cellular aspects of the insulin-like growth factor I receptor”. Endocr. Rev. 16 (2): 143–63.
-
Mahley RW, Rall SC. 2002. Apolipoprotein E: far more than a lipid transport protein. Annual review of genomics and human genetics 1: 507–37.
-
Maxwell, P. H. and Y. Wang. 2006. Genetic studies of IgA nephropathy. Experimental Nephrology 102: p. 76.
-
May-Hegglin/Fechtner Syndrome Consortium. 2000. Mutations in MYH9 result in the May-Hegglin anomaly, and Fechtner and Sebastian syndromes. Nature Genet. 26: 103-105.
-
Michalik L, Auwerx J, Berger JP, Chatterjee VK, Glass CK, Gonzalez FJ, Grimaldi PA, Kadowaki T, Lazar MA, O’Rahilly S, Palmer CN, Plutzky J, Reddy JK, Spiegelman BM, Staels B, Wahli W. 2006. International Union of Pharmacology. LXI. Peroxisome proliferator-activated receptors. Pharmacol. Rev. 58 (4): 726–41.
-
Mukherjee, R., Jow, L., Croston, G. E., Paterniti, J. R., Jr. 1997. Identification, characterization, and tissue distribution of human peroxisome proliferator-activated receptor (PPAR) isoforms PPAR-gamma-2 versus PPAR-gamma-1 and activation with retinoid X receptor agonists and antagonists. J. Biol. Chem. 272: 8071-8076.
-
Mulligan, L. M., Kwok, J. B. J., Healey, C. S., Elsdon, M. J., Eng, C., Gardner, E., Love, D. R., Mole, S. E., Moore, J. K., Papi, L., Ponder, M. A., Telenius, H., Tunnacliffe, A., Ponder, B. A. J. 1993. Germ-line mutations of the RET proto-oncogene in multiple endocrine neoplasia type 2A. Nature 363: 458-460.
-
Nicolson GL. 1988. Cancer metastasis: tumor cell and host organ properties important in metastasis to specific secondary sites. Biochim. Biophys. Acta 948(2): 175–224.
-
Online Mendelian Inheritance in Man: An Online Catalog of Human Genes and Genetic Disorders. http://www.omim.org/
-
Pascual, G., Fong, A. L., Ogawa, S., Gamliel, A., Li, A. C., Perissi, V., Rose, D. W., Willson, T. M., Rosenfeld, M. G., Glass, C. K. 2005. A SUMOylation-dependent pathway mediates transrepression of inflammatory response genes by PPAR-gamma. (Letter) Nature 437: 759-763.
-
Pasini, B., Hofstra, R. M. W., Yin, L., Bocciardi, R., Santamaria, G., Grootscholten, P. M., Ceccherini, I., Patrone, G., Priolo, M., Buys, C. H. C. M., Romeo, G. 1995. The physical map of the human RET proto-oncogene. Oncogene 11: 1737-1743.
-
Pelet, A., Geneste, O., Edery, P., Pasini, A., Chappuis, S., Attie, T., Munnich, A., Lenoir, G., Lyonnet, S., Billaud, M. 1998. Various mechanisms cause RET-mediated signaling defects in Hirschsprung’s disease. J. Clin. Invest. 101: 1415-1423.
-
Pollard, Thomas D.; Korn, Edward D. 1973. Acanthamoeba myosin I. Isolation from Acanthamoeba castellanii of an enzyme similar to muscle myosin. The Journal of Biological Chemistry 248 (13): 4682–90.
-
Raile, K., Klammt, J., Schneider, A., Keller, A., Laue, S., Smith, R., Pfaffle, R., Kratzsch, J., Keller, E., Kiess, W. 2006. Clinical and functional characteristics of the human arg59ter insulin-like growth factor I receptor (IGF1R) mutation: implications for a gene dosage effect of the human IGF1R. J. Clin. Endocr. Metab. 91: 2264-2271.
-
Robbins SL, Cotran RS, Kumar V, Collins T. 1999. Robbins pathologic basis of disease. Philadelphia: WB Saunders.
-
Seri, M., Pecci, A., Di Bari, F., Cusano, R., Savino, M., Panza, E., Nigro, A., Noris, P., Gangarossa, S., Rocca, B., Gresele, P., Bizzaro, N., and 13 others. 2003. MYH9-related disease: May-Hegglin anomaly, Sebastian syndrome, Fechtner syndrome, and Epstein syndrome are not distinct entities but represent a variable expression of a single illness. Medicine 82: 203-215.
-
Singh et al. 2010. A susceptible haplotype within APOE gene influences BMD and intensifies the osteoporosis risk in postmenopausal women of Northwest India. Maturitas 67: p. 239.
-
Sullivan, P. M., Mezdour, H., Quarfordt, S. H., Maeda, N. 1998. Type III hyperlipoproteinemia and spontaneous atherosclerosis in mice resulting from gene replacement of mouse Apoe with human APOE*2. J. Clin. Invest. 102: 130-135.
-
Tyska, Matthew J.; Warshaw, David M. 2002. The myosin power stroke. Cell Motility and the Cytoskeleton 51 (1): 1–15.
-
Veiga-Fernandes, H., Coles, M. C., Foster, K. E., Patel, A., Williams, A., Natarajan, D., Barlow, A., Pachnis, V., Kioussis, D. 2007. Tyrosine kinase receptor RET is a key regulator of Peyer’s patch organogenesis. Nature 446: 547-551.
-
Wang, N., Chintala, S. K., Fini, M. E., Schuman, J. S. 2001. Activation of a tissue-specific stress response in the aqueous outflow pathway of the eye defines the glaucoma disease phenotype. Nature Med. 7: 304-309.
-
Wang et al. 2013. Polymorphisms in SELE gene and risk of coal workers pneumoconiosis in Chinese: A case-control study.
-
Warshamana-Greene GS, Litz J, Buchdunger E, García-Echeverría C, Hofmann F, Krystal GW. 2005. The insulin-like growth factor-I receptor kinase inhibitor, NVP-ADW742, sensitizes small cell lung cancer cell lines to the effects of chemotherapy. Clin. Cancer Res. 11 (4): 1563–71.
-
Weisgraber KH, Innerarity TL, Mahley RW. 1982. Abnormal lipoprotein receptor-binding activity of the human E apoprotein due to cysteine-arginine interchange at a single site. J. Biol. Chem. 257(5): 2518–21.
-
Werner, H., Karnieli, E., Rauscher, F. J., III, LeRoth, D. 1996.Wild-type and mutant p53 differentially regulate transcription of the insulin-like growth factor I receptor gene. Proc. Nat. Acad. Sci. 93: 8318-8323.
-
Yen, C.J., Beamer, B. A., Negri, C., Silver, K., Brown, K. A., Yarnall, D. P., Burns, D.K., Roth, J., Shuldiner, A. R. 1997. Molecular scanning of the human peroxisome proliferator activated receptor gamma (hPPAR-gamma) gene in diabetic Caucasians: identification of a pro12ala PPAR-gamma-2 missense mutation. Biochem. Biophys. Res. Commun. 241: 270-274.
Analysis of differential gene expression associated with Type II Diabetes
Shivin Madivanan, Kaitlyn Fragogiannis, & Sothivin Lanh
BACKGROUND
Type 2 Diabetes is a condition where the body either does not produce enough insulin to maintain a normal glucose level or the body resists the effects of insulin. Type 2 diabetes is the most common form of diabetes and affects over 20 million children and adults in the United States. Overtime, high blood glucose levels may damage a person’s eyes, kidneys, nerves, and/or heart and, if left untreated, could be life threatening. Certain pathways and proteins have been implicated in previous literature to be associated with type 2 diabetes, specifically the Wnt pathway, the tumor suppressor gene p53, protein phosphatases, and adipose differentiation-related protein.
Susceptibility to type 2 diabetes has been linked to Wnt signaling, which also plays an important role in intestinal tumorigenesis. Carriers of variants of the transcription factor 7‐like 2 gene, a component of the Wnt pathway, are thought to be at an increased risk of developing type 2 diabetes. The modulation of proglucagon expression by Wnt activity may partly illuminate the link between Wnt signaling and diabetes (Bordonaro 2009).
P53 is a tumor suppressor gene and mutations of p53 have been implicated in many cancers. Many studies are now also suggesting that p53 is associated with type 2 diabetes as well. Studies have shown that the polymorphism in P53 leads to the amino acid change Pro72Arg, which has higher apoptotic potential (Burgdorf et al 2011). Studies have also implicated that the allele G in p53 in particular is a risk factor for diabetes 2 and may be a possible link between increased pancreatic B cell apoptosis and impaired insulin secretion (Qu et al 2011).
Protein phosphatases mediate dephosphorylation and are known to act on a number of enzymes involved in the insulin regulation of glucose uptake and glycogen synthesis (Holland et al 2011). Some studies have suggested that enhanced protein phosphatase activities and subsequent increased protein dephosphorylation may play an important role in cardiac dysfunction in diabetes and that impaired down-regulation of PP2A-C alpha expression due to insulin could be a marker for insulin resistance and also be a contributer to the pathogenesis of type 2 diabetes (Rastogi 2003).
Another study also found a striking change in diabetic kidneys versus healthy kidneys in the induction of genes normally expressed in adipocytes and related to lipid homeostasis. Excess intracellular lipids in other nonadipose tissues has been linked to insulin resistance and cellular damage. One of the genes in particular that has been implicated to be important in the formation of lipid storage droplets is ADRP or adipophillin (Rangnath 2004).
In our project we are going to look at the gene expression differences between healthy and diabetic Mus musculus kidney tissue. Based on these previous literature findings we expect to see differential gene expression in the following pathways: Wnt signaling, p53, protein phosphatases, and ADRP.
OBJECTIVE
The objective of our study was focused at exploring which genes were differentially expressed between two phenotypes: normal, healthy cells and cells that had type 2 diabetes. More specifically, we were interested in determining which components of cellular pathways and functions would be affected by type 2 diabetes, including how they were affected and to what extent.
METHODOLOGY
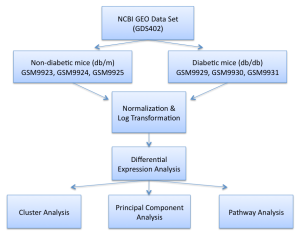
Figure 1. Methodology flow chart
In this study, we used a microarray data set from NCBI’s Gene Expression Ombnibus database (GDS402), which included gene expression data taken from the kidney tissue of mice with and without type 2 diabetes. The figure below shows the samples that were taken. There were 12 samples total: 6 samples taken at 8 weeks of age and 6 samples taken at 16 weeks of age. Of each sampling time of the 6 samples, 3 of the samples had the phenotype of “no diabetes” (db/m) and the other 3 samples had the phenotype of “diabetes” (db/db). We only analyzed the 16-week samples to avoid any biological lower limit of pre-maturity, where diabetes would not have had enough time to manifest noticeable influences on the cellular pathways and functions. From the 16-week samples, there were over 12,000 genes that were included in the gene expression data set.
Figure 2. NCBI GEO GDS402 data profile
After retrieving the aforementioned data set from NCBI’s GEO database, we normalized the data and performed a log transformation thereafter. Then, we used a two-tailed Student’s t-test to determine which genes among the 12,000-gene data set were showed significantly differential expression between the two phenotypes, based on a 1% p-value standard. This step allowed us to cut down the studied genes from 12,000 to less than 600 genes. After determining the differential genes, we used JMP Genomics to perform cluster analysis and principal component analysis. Finally, we used Broad Institute’s Gene Set Enrichment Analysis (GSEA) and the Kyoto Encyclopedia of Genes and Genomes (KEGG) to perform pathway analysis on the differential gene data set, in order to discern which cellular pathways and functions were implicated with type 2 diabetes.
RESULTS
Cluster Analysis
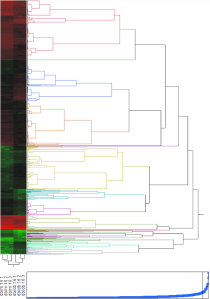
Figure 3. Cluster tree and expression heat map
From cluster analysis, we found that groups of genes were either relatively up-regulated (green) or relatively down-regulated (red), according to the respective phenotype. That is, for a particular group of genes, they were either up- or down-regulated in one phenotype, whereas they were either neutrally regulated or oppositely regulated in the other phenotype. The only group of proteins where this trend is not obvious is in the last down-regulated group (near the bottom of the heat map). However, upon closer observation, it can be seen that the diabetic phenotype (db/db) is slightly less down-regulated than in the non-diabetic phenotype (db/m).
Principal Component Analysis
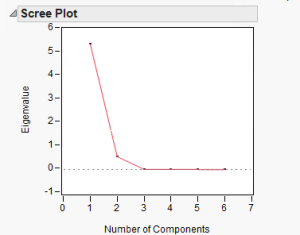
Figure 4. Scree plot of principal components
Using principal component analysis, we found that practically all variance can be captured within the first two principal components, with almost all of the variance within the first principal component. Therefore, the majority of the data can be represented within the first principal component.
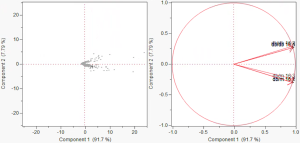
Figure 5. Scatter plots
Afterwards, we plotted the gene expression data within the dimensions of the first two principal components. As seen in the plot on the left, there is a split between the data across the axis of the second principal component. From this plot, the points that are closer together are interpreted to suggest that they display similar behavior, whereas plots that are farther apart suggest that they are differential in behavior. Comparing the left plot with the one on the right, we confirmed that the diabetic phenotype (db/db) and non-diabetic phenotype (db/m) are differentially expressed and that the points within those phenotypes are similar in behavior.
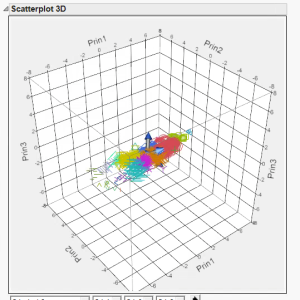
Figure 6. 3D Scatter plot
From the default view of the 3D scatter plot, it can be seen that the data is primarily represented in the first two principal components. Even with the third principal component included in the plot, there is no significant representation in this extra dimension. Besides the small groupings on the leftward side of the plot, all of the other groups are well grouped together, as seen in the previous figure (Fig. 5).
Pathway Analysis
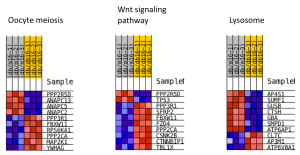
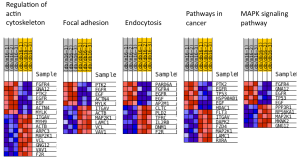
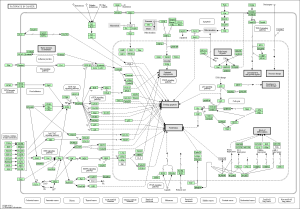
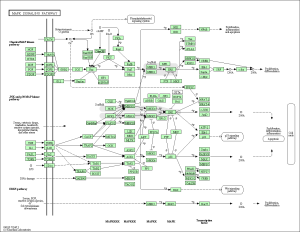
Upon performing pathway analysis using GSEA and the KEGG database, we found that the differential genes compressed into a few significant pathways. For the non-diabetic phenotype, we found that 3 pathways were differentially regulated: oocyte meiosis, Wnt signaling pathway, and lysosome. For the diabetic phenotype, we found that 5 pathways were differentially regulated: regulation of actin cytoskeleton, focal adhesion, endocytosis, pathways in cancer, and MAPK signaling pathway.
Figure 7. Differential pathways in non-diabetic kidney tissue
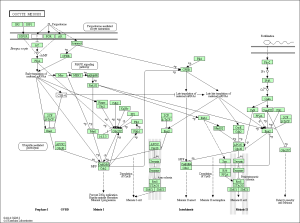
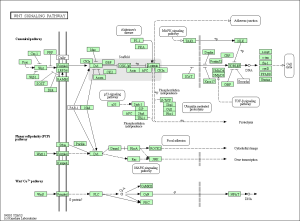
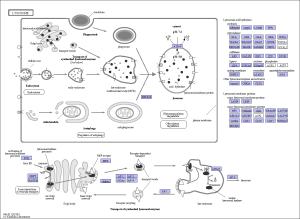
As seen in the figure above, the differentially expressed genes within the 3 pathways from non-diabetic tissue are either relatively up-regulated or down-regulated in a particular phenotype and oppositely regulated in the other phenotype. Based off our review of previous research studies, the most influential genes among these pathways are the protein phosphatases and p53 (denoted as “TP53”). Another interesting gene that isn’t mentioned in previous research literature is the MAP2K1 gene. The figures below (Fig. 8-10) show the KEGG flow diagram of these pathways and where the differentially expressed genes play their roles.
Figure 8. Oocyte meiosis pathway from KEGG
Figure 9. Wnt signaling pathway from KEGG
Figure 10. Lysosome pathway from KEGG
Figure 11. Differential pathways in diabetic kidney tissue
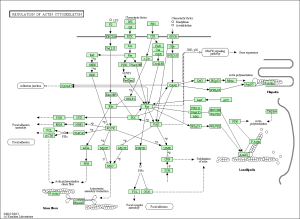
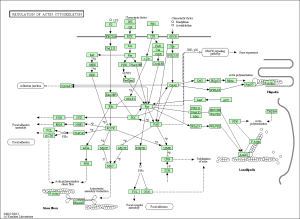
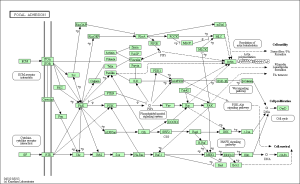
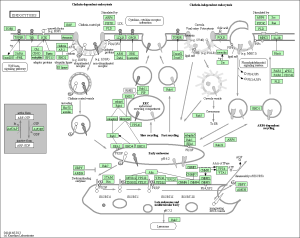
As seen in the figure above, the differentially expressed genes within the 5 pathways from diabetic tissue are either relatively up-regulated or down-regulated in a particular phenotype and oppositely regulated in the other phenotype. This is a similar trend seen in the pathways of the non-diabetic tissue. Based off our review of previous research studies, the most influential genes among these pathways are p53 (denoted as “TP53”), EGF/EGFR, protein phosphataste (specifically, PPP3R1), and ACTN4. While we did not explicitly mention EGF/EGFR and ACTN4 previously, these genes play a prominent role alongside p53 in the proliferation and metastasis of cancerous cells. The MAP2K1 gene is seen again among these pathways as well as another gene not mentioned in previous literature: PTK2. The figures below (Fig. 12-16) show the KEGG flow diagram of these pathways and where the differentially expressed genes play their roles.
Figure 12. Regulation of actin cytoskeleton from KEGG
Figure 13. Focal adhesion pathway from KEGG
Figure 14. Endocytosis pathway from KEGG
Figure 15. Pathways in cancer from KEGG
Figure 16. MAPK signaling pathway from KEGG
CONCLUSION
The findings from our study and pathway analysis support our initial hypothesis; we saw differential gene expression in most of the pathways and proteins we predicted that had also been implicated in diabetes in previous literature. These pathways included some cancer pathways and the Wnt signaling pathway, as well as pathways not previously mentioned in literature, such as the oocyte meiosis pathway. There was differential gene expression in the p53 gene and EGF/EGFR proteins within cancer pathways and differences in gene expression in protein phosphatases in the Wnt signaling as well as oocyte meiosis pathways. We also found two other proteins to be differentially expressed, MAP2K1 and PTK2, also not previously listed in literature to be associated with type 2 diabetes. MAP2K1 and PTK2 have been implicated in cancer pathways, being involved in cells division and focal adhesion, respectively, so they may be similarly associated with diabetes as are the p53 gene and EGF/EGFR proteins. More specifically, MAP2K1 is associated with the MAPK signaling pathway and helps to regulate cell proliferation and differentiation among other developmental cellular processes; PTK2 is associated with focal adhesion and has been seen to affect metastasis in cancerous cells. Based on our pathway analysis findings and the support from previous literature we conclude that these pathways and proteins are important in the pathogenesis or induction of diabetes and could be future targets for therapeutic applications to treat diabetes.
NOTE: Click on the figure images to be redirected to a larger versions of the figures.
REFERENCES
- Bordonaro, M. 2009. Role of Wnt signaling in the development of type 2 diabetes. Vitam Horm. 80:563-81.
- Burgdorf, K. S., N. Grarup, O. Pedersen. 2011. Studies of the association of Arg72Pro of tumor suppressor protein p53 with type 2 diabetes in a combined analysis of 55,521 Europeans. Plos One. 6(1): e15813.
- Holland, K. et al. 2002. Effect of insulin on protein phosphatase 2A expression in muscle in type 2 diabetes. Eur J Clin Invest. 32(12): 918-923.
- Rangnath, M., S. N. Emancipator, C. Miller, T. Kern, M. S. Simonson. 2004. Adipose differentiation-related protein and regulators of lipid homeostasis identified by gene expression profiling in the murine db/db diabetic kidney. Am J Physiol Renal Physiol. 286: F913-F921.
- Rastogi, S. et al. 2003. Elevated levels of protein phosphatase 1 and 2A may contribute to cardiac dysfunction in diabetes. Biochem Biophys Acta.
- Qu, L., B. He, Y. Pan, Y. Xu, C. Zhu, Z. Tang, Q. Bao, F. Tian, S. Wang .2011. Association between polymorphisms in RAPGEF1, TP53, NRF1 and type 2 diabetes in Chinese Han population. Diabetes Research and Clinical Practice.
